Aggradation and preserved time
Suppose we want to compute the effect of background aggradation on the preservation of time in a stratigraphic section. A simple way to do this would be to determine the fraction of model time intervals that are preserved in the stratigraphic section (\(F_t\)) as:
where \(t\) is a time interval in the total number of intervals \(T\) from the model time series, and \(I\) is an indicator function taking a value of 1 if time interval \(t\) is present in the section, and otherwise 0.
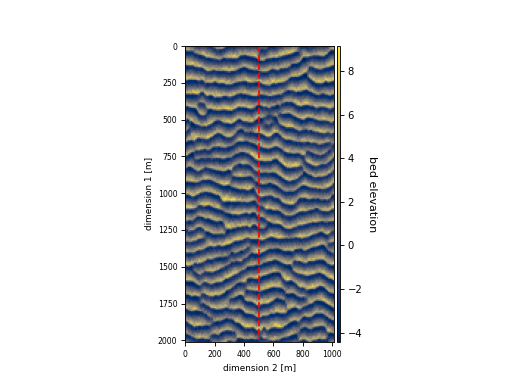
We’ll use the aeolian data set as an example here, and do stratigraphic calculation using the compute_boxy_stratigraphy_volume function.
aeolian = dm.sample_data.aeolian()

fig, ax = plt.subplots()
ax.plot([500, 500], [0, 2000], c='r', ls='--')
aeolian.quick_show('eta', ax=ax, ticks=True, colorbar_label=True)
ax.set_xlabel('dimension 2 [m]', fontsize=8)
ax.set_ylabel('dimension 1 [m]', fontsize=8)
ax.tick_params(labelsize=7)
plt.show()
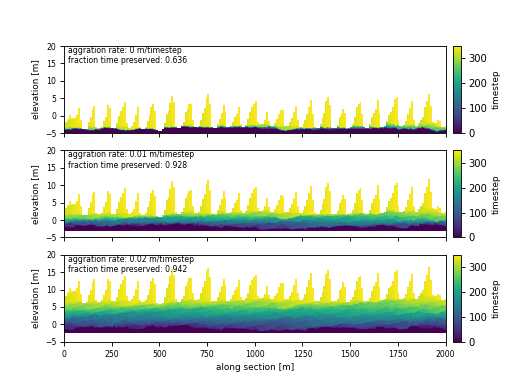
Using the compute_boxy_stratigraphy_volume function allows us to augment the bed elevation time series with a background aggradation.
# define rates, in m/timestep
agg_rates = [0, 0.01, 0.02]

fig, ax = plt.subplots(
    len(agg_rates), 1,
    sharex=True, sharey=True)

for i, ar in enumerate(agg_rates):
    # set up the aggradation array
    agg_array = np.tile(
        np.linspace(0, aeolian.shape[0]*ar, num=aeolian.shape[0]).reshape(-1, 1, 1),
        (1, aeolian.shape[1], aeolian.shape[2]))

    # compute stratigraphy for elevation timeseries plus aggradation
    vol, elev = dm.strat.compute_boxy_stratigraphy_volume(
        aeolian['eta']+agg_array, aeolian['time'],
        dz=0.1)

    # section index and calculation for preservation
    sec_idx = aeolian.shape[2] // 2
    sec_data = vol[:, :, sec_idx]
    sec_data_flat = sec_data[~np.isnan(sec_data)]
    fraction_preserved = (len(np.unique(sec_data_flat)) / aeolian.shape[0])

    # show a slice through the section
    im = ax[i].imshow(
        vol[:, :, sec_idx],
        extent=[0, aeolian.dim1_coords[-1], elev.min(), elev.max()],
        aspect='auto', origin='lower')
    cb = dm.plot.append_colorbar(im, ax=ax[i])
    cb.ax.set_ylabel(aeolian['time']['time'].units, fontsize=8)

    # label
    ax[i].text(
        20, 15,
        (f'aggration rate: {ar:} m/timestep\n'
         f'fraction time preserved: {fraction_preserved:}'),
        fontsize=7)

for axi in ax.ravel():
    axi.set_ylabel('elevation [m]', fontsize=8)
    axi.set_ylim(-5, 20)
    axi.tick_params(labelsize=7)

ax[i].set_xlabel('along section [m]', fontsize=8)

plt.show()
