debug_tools
The debugging tools are defined in pyDeltaRCM.debug_tools.
Todo
Add paragraph description of the module. What stages are defined here generally?
Public API methods attached to model
The following methods are defined in the debug_tools class, of the pyDeltaRCM.debug_tools module.
They are then attached as methods of the DeltaModel and can be called at any time during run.
Debugging tools. |
- class pyDeltaRCM.debug_tools.debug_tools
Debugging tools.
These tools can be invoked as part of a script during runtime or in a Python debugging shell.
Add
breakpoint()to any line in the code to enter the debugger and use these tools interactively at that breakpoint. Note, for Python < 3.7 usepdb.set_trace().Examples
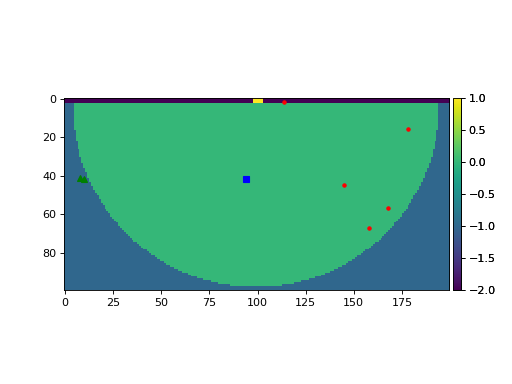
Within a debugging shell:
>>> self.show_attribute('cell_type', grid=False)
>>> self.show_ind([3378, 9145, 11568, 514, 13558])
>>> self.show_ind((42, 94), 'bs')
>>> self.show_ind([(41, 8), (42, 10)], 'g^')
>>> plt.show()
- show_attribute(attribute: str, **kwargs) None
Show an attribute over the model domain.
Show any attribute of the
DeltaModelclass over the model domain.- Parameters:
attribute (
str) – Name of the attribute you want to show.ax (
matplotlib.Axesobject, optional) – Which axes to render attribute into. Usesgca()if no axis is provided.grid (
bool, optional) – Whether to plot a grid over the domain to demarcate individual cells. Default is True (show the grid).block (
bool, optional) – Whether to show the plot automatically. Default is False (do not show automatically).
- show_ind(ind, *args, **kwargs) None
Show points within the model domain.
Show the location of points (indices) within the model domain. Can show points as tuple
(x, y), flat indexidx, list of tuples[(x1, y1), (x2, y2)], or list of flat indices[idx1, idx2]. Method takes arbitrary matplotlib arguments to plot the points as Matlab-style args ('r*') or keyword arguments (marker='s').- Parameters:
ind (
tuple, int, list of tuple, list of int, list of int and tuple) – Index (indices if list), to plotax (
matplotlib.Axesobject, optional) – Which axes to render point into. Usesgca()if no axis is provided.block (
bool, optional) – Whether to show the plot automatically. Default is False (do not show automatically).*args (
str, optional) – Matlab-style point specifications, e.g.,'r*','bs'.**kwargs (optional) – Any kwargs supported by matplotlib.pyplot.plt.
- show_line(ind, *args, multiline: bool = False, nozeros: bool = False, **kwargs)
Show line within the model domain.
Show the location of lines (a series of connected indices) within the model domain. Can show points as a list/array of flat index
[i0, i1,
i2]
, list of tuples[(x1, y1), (x2, y2)], array of pairs[[x1, y1], [x2, y2]], or array of lines if given as flat index[[l0i0, l1i0, l2i0], [l0i1, l1i1, l2i1]]. Method takes arbitrary matplotlib arguments to plot the points as Matlab-style args ('r*') or keyword arguments (marker='s').- Parameters:
ind – Indicies to plot.
ax (
matplotlib.Axesobject, optional) – Which axes to render point into. Usesgca()if no axis is provided.block (
bool, optional) – Whether to show the plot automatically. Default is False (do not show automatically).multiline (
bool, optional) – When a 2D array is passed as ind, this boolean indicates whether to treat each column of the array as a separate line. Default is False.nozeros (
bool, optional) – Whether to show segements of lines with a flat index == 0 `. Default is `False.*args (
str, optional) – Matlab-style point specifications, e.g.,'r*','bs'.**kwargs (optional) – Any kwargs supported by matplotlib.pyplot.plt.
- Returns:
lines – Lines plotted by call to show_line, returned as a list, even if only one line plotted.
- Return type:
list
Public plotting methods
The functions defined below are (generally) the actual workers that handle the plotting for the methods defined above and attached to model. We expose these functions here because they are be useful in the documentation, where they are used extensively.
- pyDeltaRCM.debug_tools.plot_domain(attr, ax=None, grid: bool = True, block: bool = False, label=None, **kwargs) None
Plot the model domain.
Public function to plot any 2d grid with helper display utils. This function is called by the DeltaModel method
show_attribute.- Parameters:
attr (
ndarray) – The data to display, as a 2D numpy array.ax (
matplotlib.Axes, optional) –- Which axes to render point into. Uses
gca()if no axis is provided.
- Which axes to render point into. Uses
grid (
bool, optional) – Whether to plot a grid over the domain to demarcate individual cells. Default is True (show the grid).block (
bool, optional) – Whether to show the plot automatically. Default is False (do not show automatically).label (
str, optional) – A string describing the field being plotted. If given, will be appeneded to the colorbar of the domain plot.
- pyDeltaRCM.debug_tools.plot_ind(_ind, *args, shape=None, **kwargs) None
Plot points within the model domain.
Todo
write a complete docstring with parameters etc.
Method called by
show_ind.Examples
Todo
add examples, pull from tests.
- pyDeltaRCM.debug_tools.plot_line(_ind, *args, shape=None, nozeros: bool = False, **kwargs)
Plot a line within the model domain.
Method called by
show_line.Todo
write a complete docstring with parameters etc.
Examples
Todo
add examples, pull from tests.