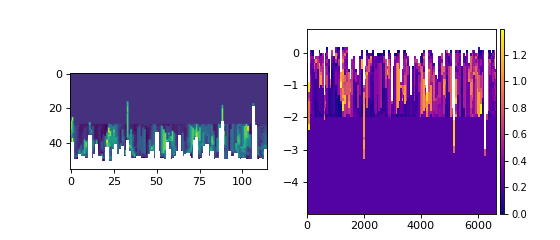
View a section slice
>>> golfcube = dm.sample_data.golf()
>>> golfstrat = dm.cube.StratigraphyCube.from_DataCube(
...     golfcube, dz=0.1)
>>> circular = dm.section.CircularSection(golfstrat, radius=2000)
You can visualize the data yourself, or use the built-in show() method of a Section.
>>> fig, ax = plt.subplots(1, 2, figsize=(7, 3))
>>> ax[0].imshow(circular['velocity'])   # display directly
>>> circular.show('velocity', ax=ax[1])  # use the built-in show()
>>> plt.show()

Hint
Use origin='lower' in imshow if you plan to show the data yourself!
See also
- Introduction to Section objects
Subject guide on Section operations and classes
- Visualization Guide
Subject guide on visualization in DeltaMetrics