Visualization Guide
This guide covers the full range of visualization routines available as part of DeltaMetrics, and explains how to create your own visualization routines that build on top of DeltaMetrics.
Default styling
By default, each variable receives a set of styling definitions. The default parameters of each styling variable are defined below:
Section display types
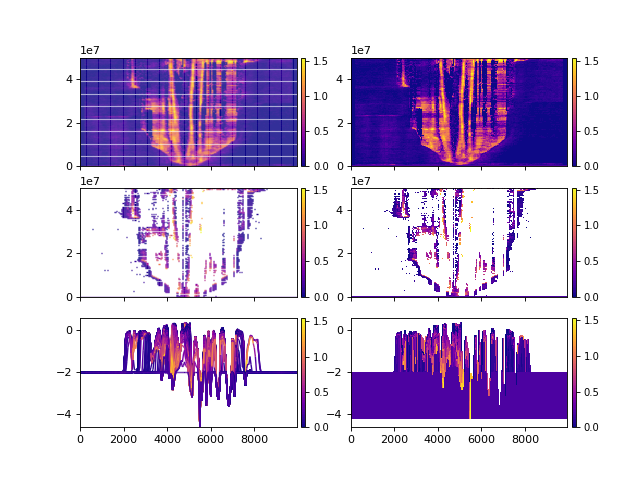
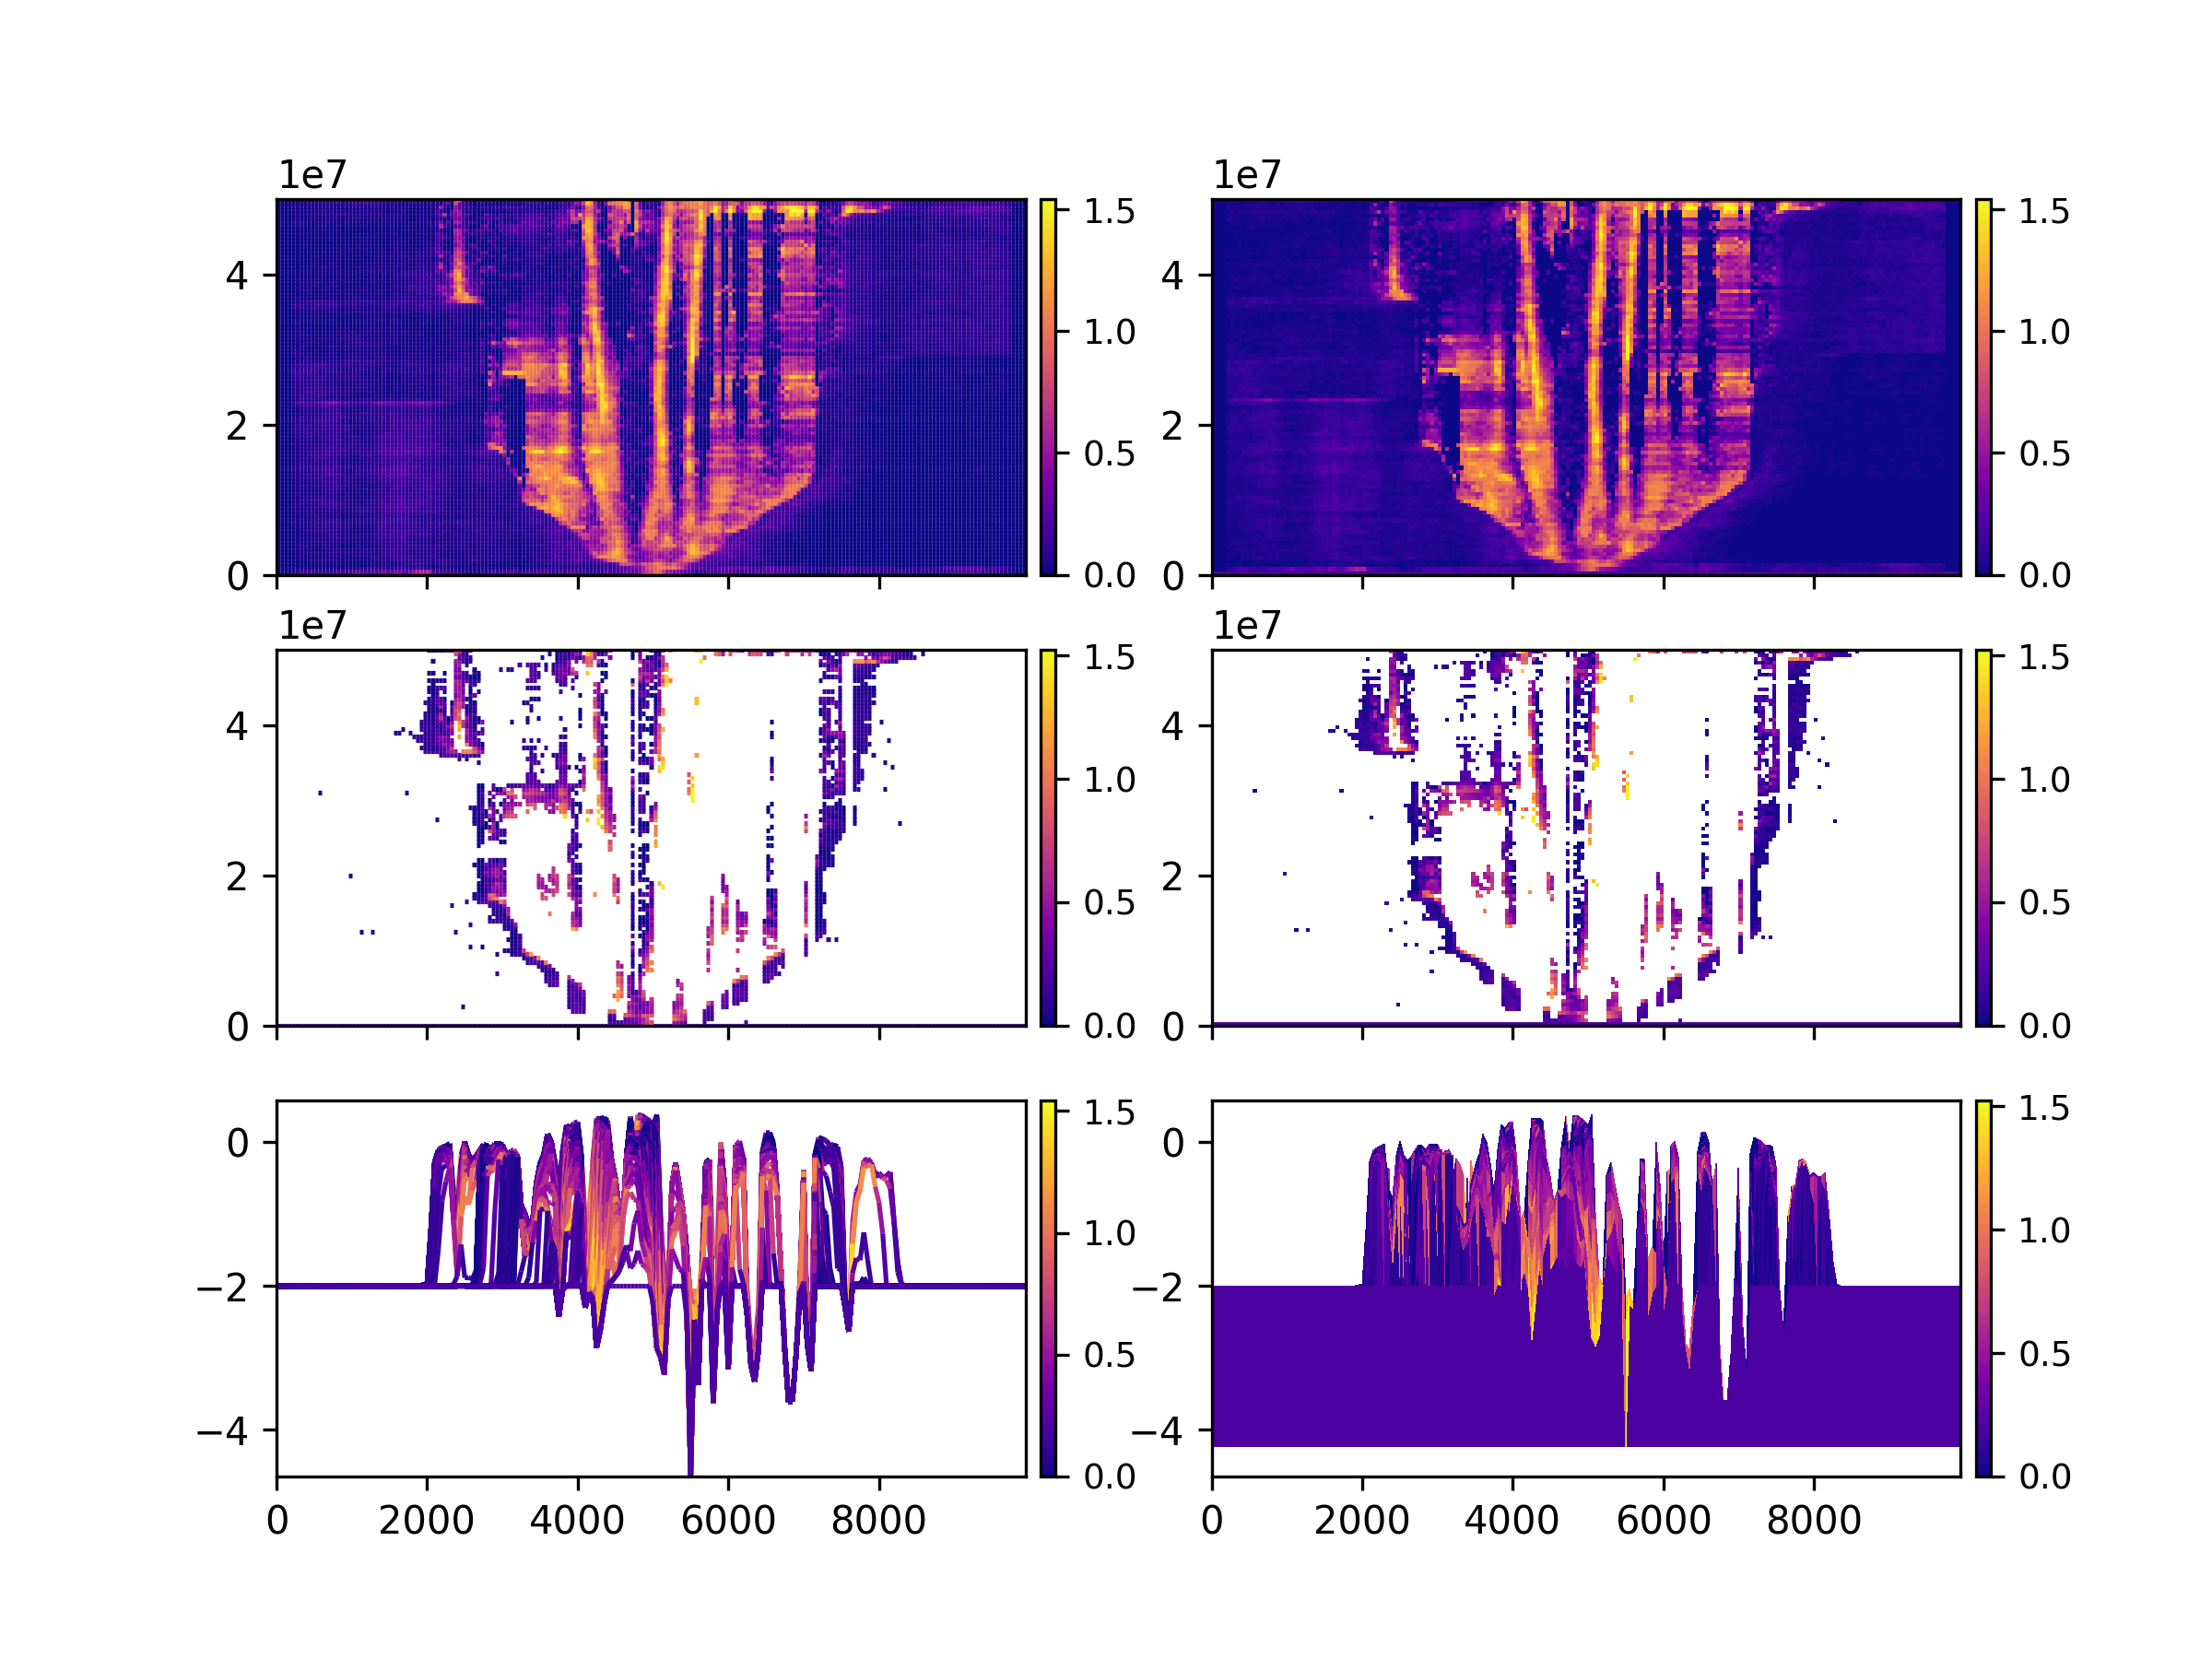
DataCube with computed “quick” stratigraphy may be visualized a number of different ways.
>>> golfcube = dm.sample_data.golf()
>>> golfcube.stratigraphy_from('eta')
>>> golfcube.register_section('demo', dm.section.StrikeSection(distance_idx=10))
>>> _v = 'velocity'

>>> fig, ax = plt.subplots(3, 2, sharex=True, figsize=(8, 6))
>>> golfcube.sections['demo'].show(_v, style='lines',
...     data='spacetime', ax=ax[0,0])
>>> golfcube.sections['demo'].show(_v, style='shaded',
...     data='spacetime', ax=ax[0,1])
>>> golfcube.sections['demo'].show(_v, style='lines',
...     data='preserved', ax=ax[1,0])
>>> golfcube.sections['demo'].show(_v, style='shaded',
...     data='preserved', ax=ax[1,1])
>>> golfcube.sections['demo'].show(_v, style='lines',
...     data='stratigraphy', ax=ax[2,0])
>>> golfcube.sections['demo'].show(_v, style='shaded',
...     data='stratigraphy', ax=ax[2,1])
>>> plt.show(block=False) #doctest +SKIP
