deltametrics.section.CircularSection
- class deltametrics.section.CircularSection(*args, radius=None, radius_idx=None, origin=None, origin_idx=None, **kwargs)
Circular section object.
Section drawn as a circular cut, located a along the arc a specified radius from specified origin. Specify the location of the circular section with radius and origin keyword parameter options. The circular section trace is interpolated to the nearest integer model domain cells, following the mid-point circle algorithm (
circle_to_cells).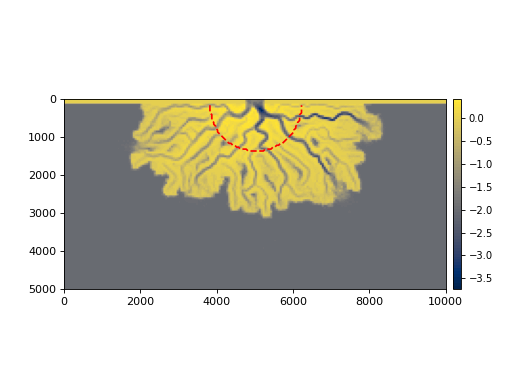
Warning
This section will not work for unequal dim1 and dim2 coordinate spacing.
- Parameters:
*args (
DataCubeor StratigraphyCube) – The Cube object to link for underlying data. This option should be ommitted if using theregister_sectionmethod of a Cube.radius (
float, optional) – The radius of the section in dimensional coordinates. This is the distance to locate the section from theorigin. If no value is given, the radius defaults to half of the minimum model domain edge length.origin (
tupleof float, optional) – The origin of the circular section in dimensional coordinates, specified as a two-element tuple(dim1, dim2). This is the center of the circle. If no value is given, the origin defaults to the center of the x-direction of the model domain, and offsets into the domain a distance ofy == L0, if this values can be determined. I.e., the origin defaults to be centered over the channel inlet.radius_idx (
float, int, optional) – The radius of the section in cell indices. This is the distance to locate the section from theorigin. Mutually exclusive with radius.origin_idx (
tupleof int, optional) – The origin of the circular section in dimensional coordinates, specified as a two-element tuple(dim1, dim2). This is the center of the circle. Mutually exclusive with origin.**kwargs – Keyword arguments are passed to BaseSection.__init__(). Supported options are name.
- Returns:
section – CircularSection object with specified parameters. The section is automatically connected to the underlying Cube data source if the
register_sectionmethod of a Cube is used to set up the section, or the Cube is passed as the first positional argument during instantiation.- Return type:
Examples
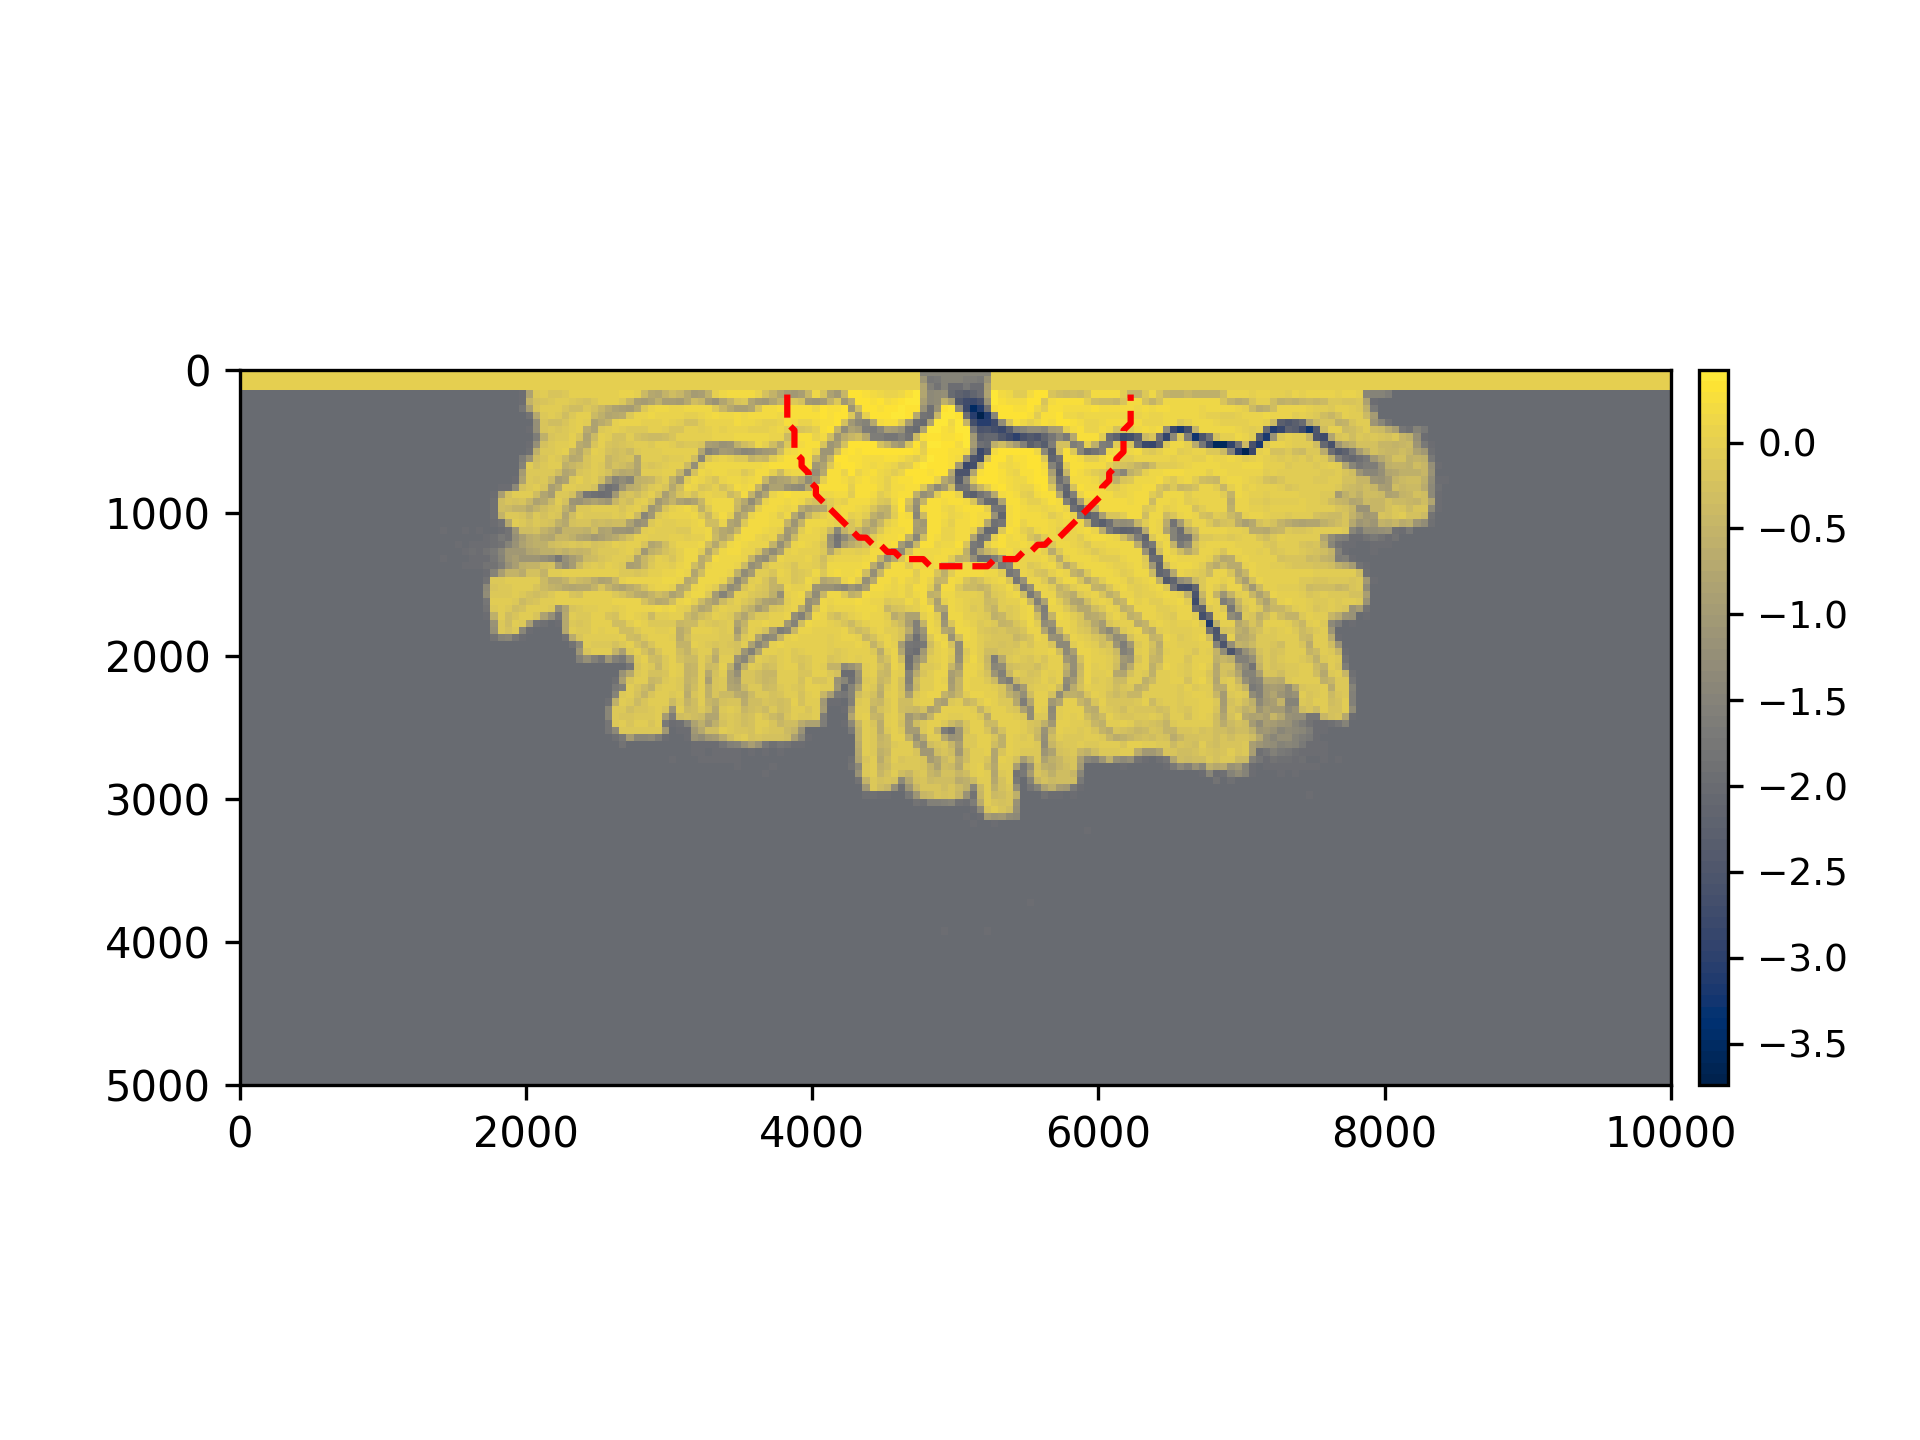
Create a CircularSection that is registered to a DataCube with radius
=1200, and using the default origin options:>>> golfcube = dm.sample_data.golf() >>> golfcube.register_section( ... 'circular', dm.section.CircularSection(radius=1200))
>>> # show the location and the "velocity" variable
>>> fig, ax = plt.subplots(2, 1, figsize=(8, 4))
>>> golfcube.quick_show('eta', idx=-1, ax=ax[0], ticks=True)
>>> golfcube.sections['circular'].show_trace('r--', ax=ax[0])
>>> golfcube.sections['circular'].show('velocity', ax=ax[1])
>>> plt.show()

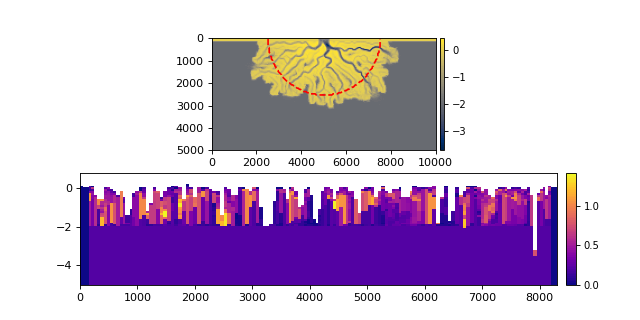
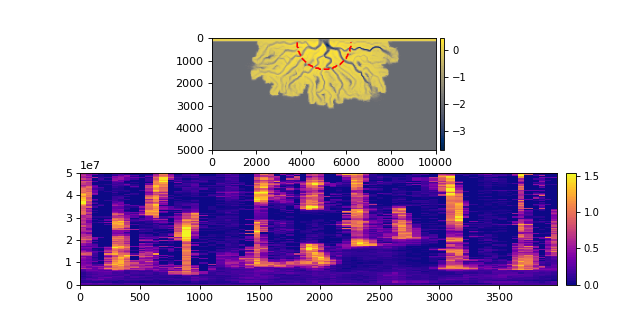
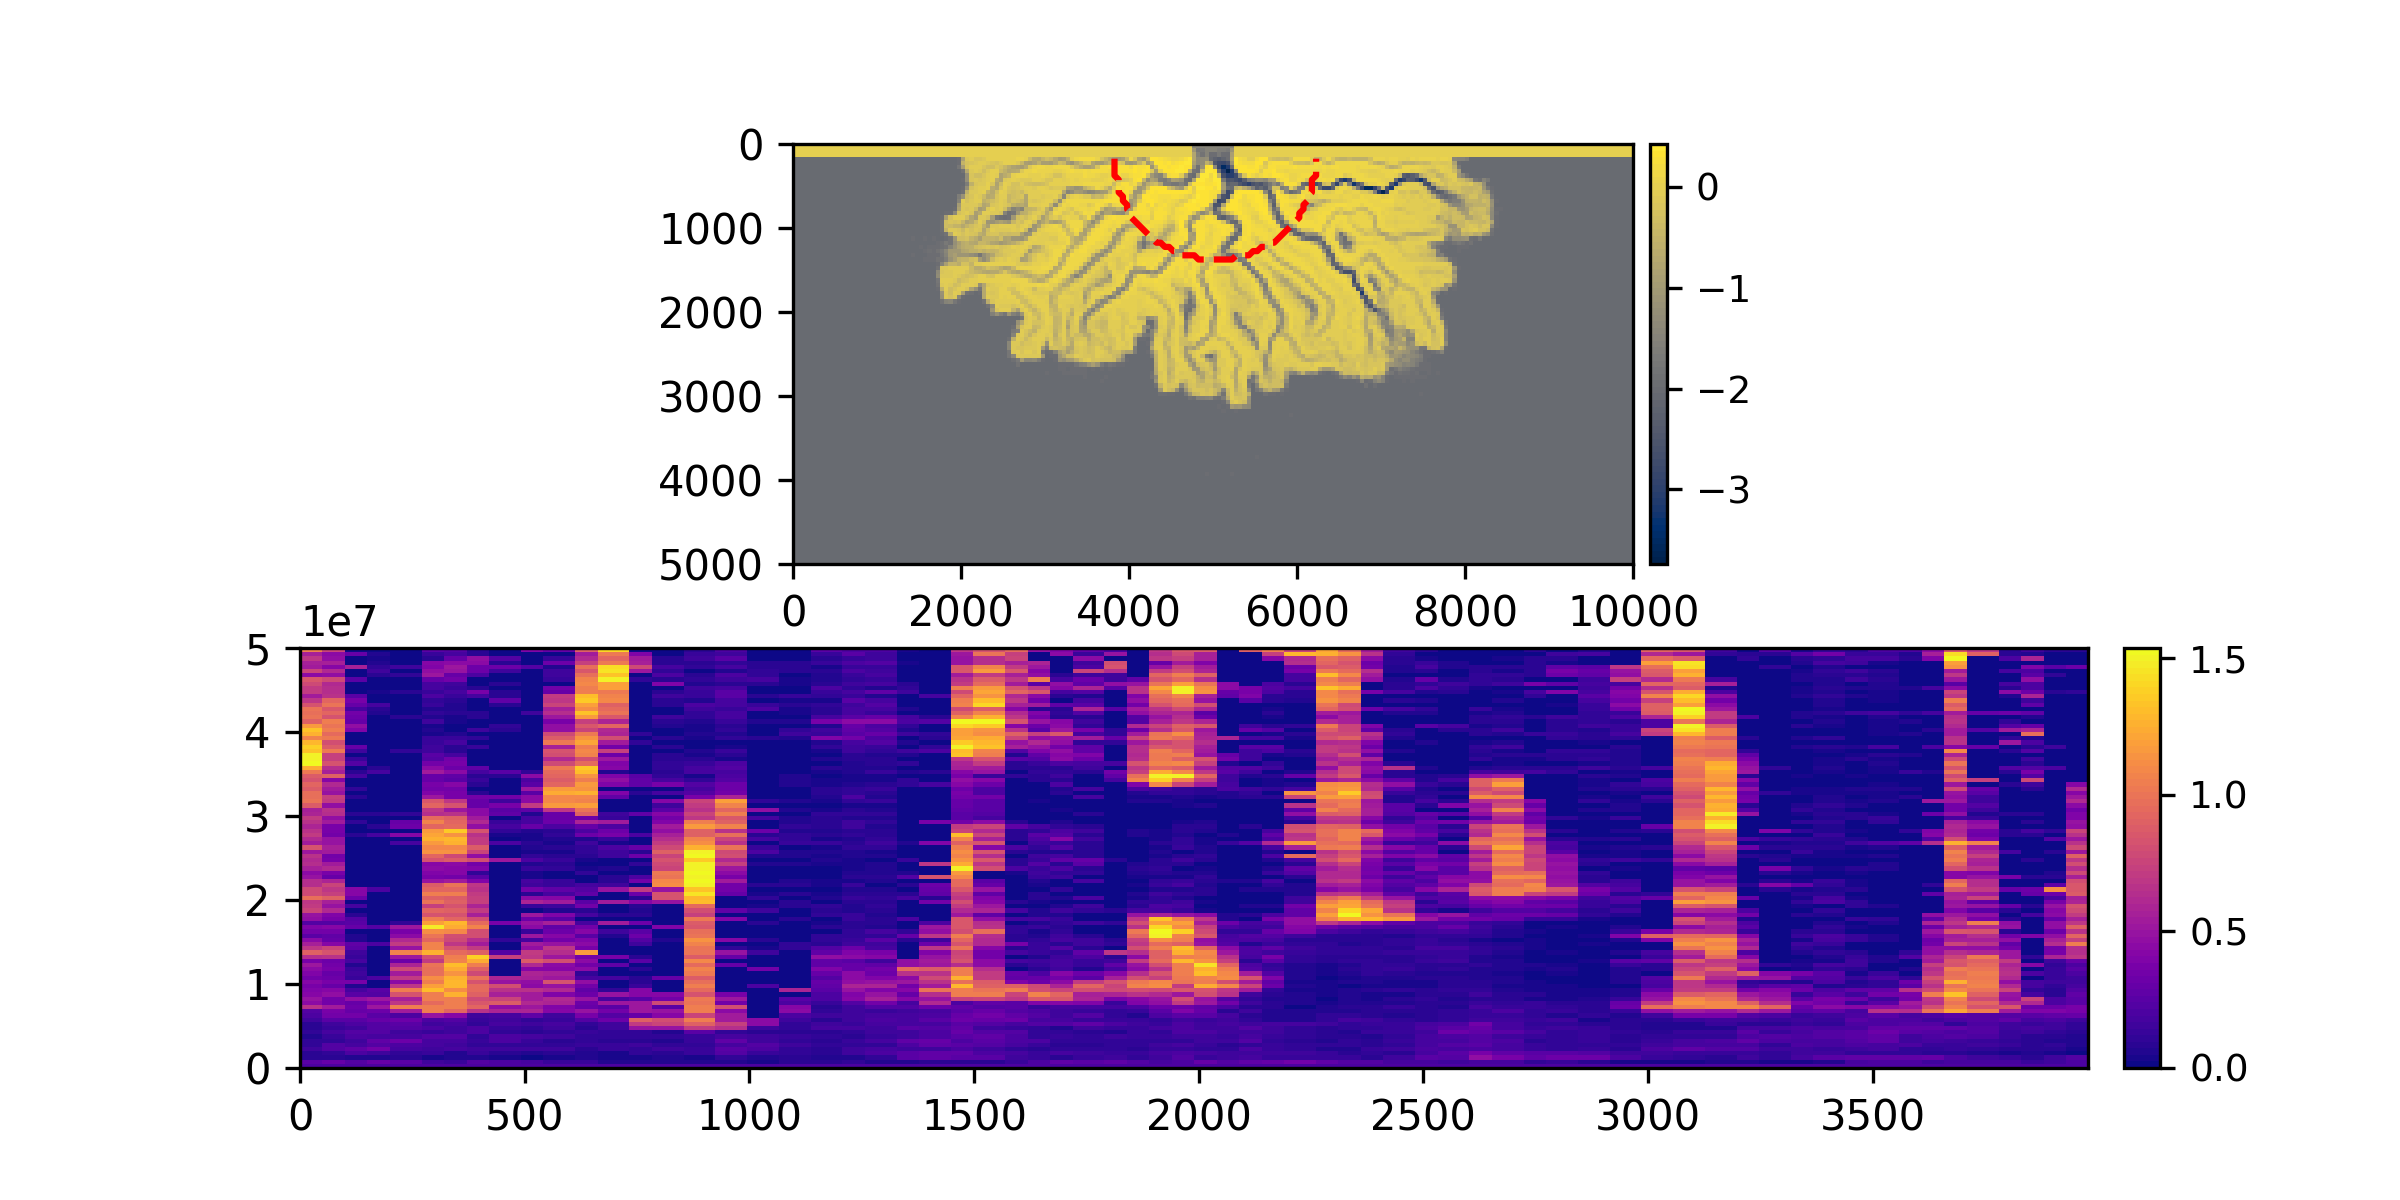
Create a CircularSection that is registered to a StratigraphyCube with radius index
=50, and the origin against the domain edge (using the origin_idx option):>>> golfcube = dm.sample_data.golf() >>> golfstrat = dm.cube.StratigraphyCube.from_DataCube(golfcube, dz=0.1) >>> golfstrat.register_section( ... 'circular', dm.section.CircularSection(radius_idx=50, ... origin_idx=(0, 100)))
>>> # show the location and the "velocity" variable
>>> fig, ax = plt.subplots(2, 1, figsize=(8, 4))
>>> golfcube.quick_show('eta', idx=-1, ax=ax[0], ticks=True)
>>> golfstrat.sections['circular'].show_trace('r--', ax=ax[0])
>>> golfstrat.sections['circular'].show('velocity', ax=ax[1])
>>> plt.show()
- __init__(*args, radius=None, radius_idx=None, origin=None, origin_idx=None, **kwargs)
Identify coordinates defining the section.
- Parameters:
section_type (
str) – String identifying the type of Section being instantiated.CubeInstance (
BaseCubesubclass, optional) – Connect to this cube. No connection is made if cube is not provided.name (
str, optional) – An optional name for the Section object, helpful for maintaining and keeping track of multiple Section objects of the same type. This is disctinct from thesection_type. The name is used internally if you use theregister_sectionmethod of a Cube. Notes
Notes
If no arguments are passed, an empty section not connected to any cube is returned. This cube will will need to be manually connected to have any functionality (via the
connect()method).
Methods
__init__(*args[, radius, radius_idx, ...])Identify coordinates defining the section.
connect(InputInstance[, name])Connect this Section instance to a Cube instance.
show(*args[, style, data, label, colorbar, ...])Show the section.
show_trace(*args[, ax, autoscale])Plot section trace (x-y plane path).
Attributes
Alias for self.trace_idx.
Length of section in dimensional coordinates.
Section name.
Origin of the section in dimensional coordinates.
Radius of the section in dimensional coordinates.
Along-section coordinate.
Section shape.
Stratigraphic attributes data object.
Coordinates of the section in the dim1-dim2 plane.
Indices of section points in the dim1-dim2 plane.
List of variables.
Up-section (vertical) coordinate.
- __getitem__(var)
Get a slice of the section.
Slicing the section instance creates an xarray DataArray instance from data, for variable
varand maintaining the data coordinates.Note
We only support slicing by string.
- Parameters:
var (
str) – Which variable to slice.- Returns:
data – The underlying data returned as an xarray DataArray, maintaining coordinates.
- Return type:
DataArray
- connect(InputInstance, name=None)
Connect this Section instance to a Cube instance.
- property idx_trace
Alias for self.trace_idx.
- property length
Length of section in dimensional coordinates.
- property name
Section name.
Helpful to differentiate multiple Section objects.
- property origin
Origin of the section in dimensional coordinates.
Hint
Returned as a point
(dim1, dim2), so will need to be reversed for plotting in Cartesian coordinates.
- property radius
Radius of the section in dimensional coordinates.
- property s
Along-section coordinate.
- property shape
Section shape.
Simply a tuple equivalent to
(len(z), len(s))
- show(*args, style='shaded', data=None, label=False, colorbar=True, colorbar_label=False, ax=None)
Show the section.
Method enumerates convenient routines for visualizing sections of data and stratigraphy. Includes support for multiple data style and multiple data choices as well.
Note
The colors for style=’lines’ are determined from the left-end edge node, and colors for the style=’shaded’ mesh are determined from the lower-left-end edge node of the quad.
- Parameters:
SectionAttribute (
str,SectionVariableInstance) – Which attribute to show. Can be a string for a named Cube attribute, or any arbitrary data. Additionally, pass no arguments and the first variable in the underlying data source list will be used.style (
str, optional) – What style to display the section with. Choices are ‘mesh’ or ‘line’.data (
str, optional) – Argument passed toget_display_arraysorget_display_lines. Supported options are ‘spacetime’, ‘preserved’, and ‘stratigraphy’. Default is to display full spacetime plot for section generated from a DataCube, and stratigraphy for a StratigraphyCube section.label (
bool, str, optional) – Display a label of the variable name on the plot. Default is False, display nothing. Iflabel=True, the label name from theVariableSetis used. Other arguments are attempted to coerce to str, and the literal is diplayed.colorbar (
bool, optional) – Whether a colorbar is appended to the axis.colorbar_label (
bool, str, optional) – Display a label of the variable name along the colorbar. Default is False, display nothing. Iflabel=True, the label name from theVariableSetis used. Other arguments are attempted to coerce to str, and the literal is diplayed.ax (
Axesobject, optional) – A matplotlib Axes object to plot the section. Optional; if not provided, a call is made toplt.gca()to get the current (or create a new) Axes object.
Examples
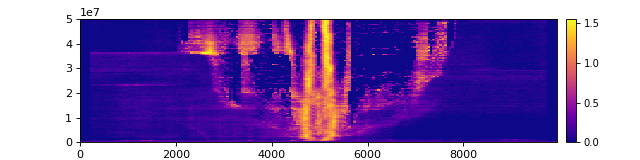
Example 1: Display the velocity spacetime section of a DataCube.
>>> golfcube = dm.sample_data.golf()
>>> golfcube.register_section(
...     'demo', dm.section.StrikeSection(distance_idx=5))
>>> golfcube.sections['demo'].show('velocity')
Note that the last line above is functionally equivalent to
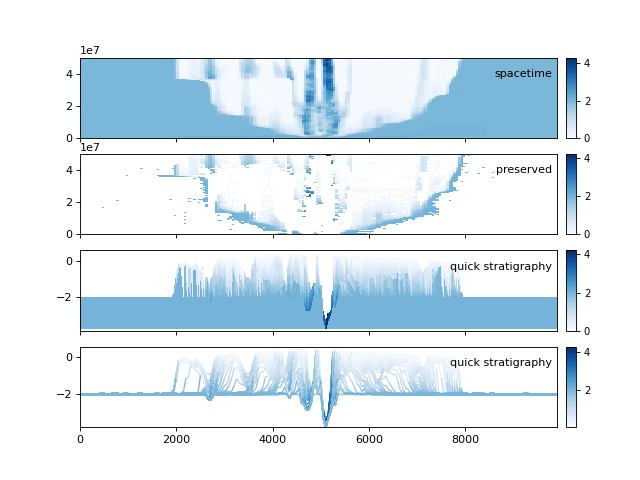
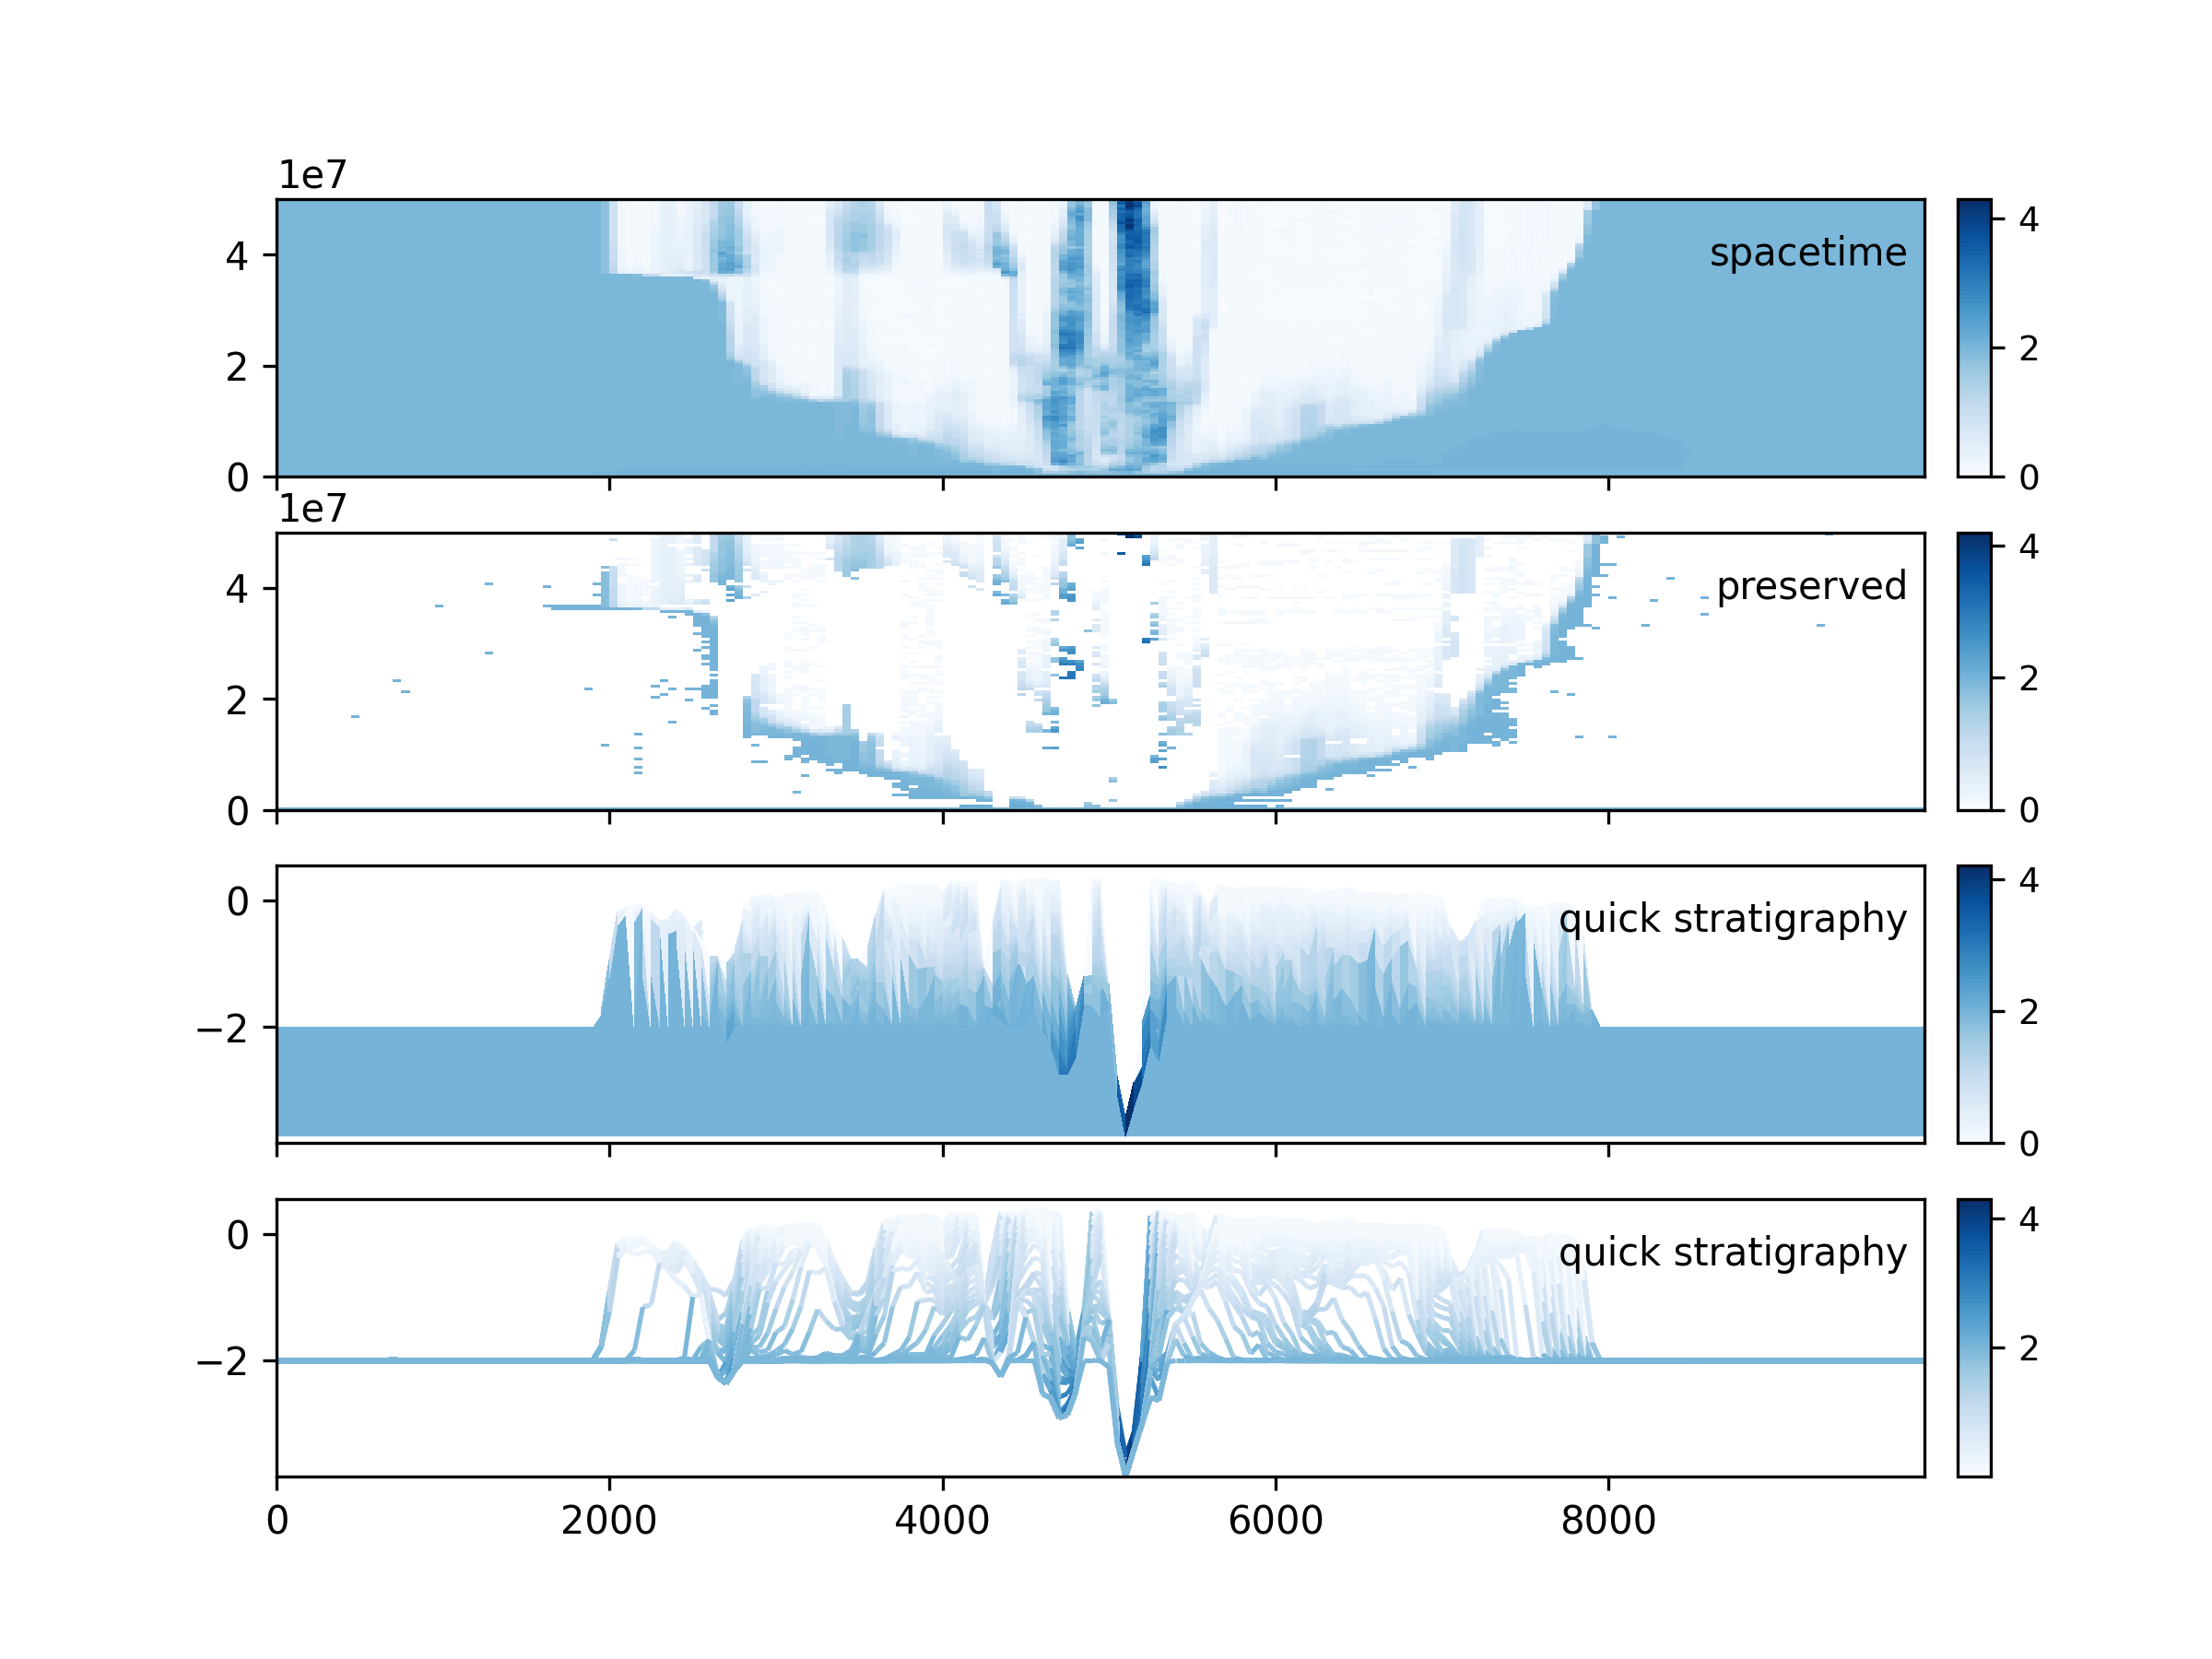
golfcube.show_section('demo', 'velocity').Example 2: Display a section, with “quick” stratigraphy, as the depth attribute, displaying several different section styles.
>>> golfcube = dm.sample_data.golf()
>>> golfcube.stratigraphy_from('eta')
>>> golfcube.register_section(
...     'demo', dm.section.StrikeSection(distance=250))

>>> fig, ax = plt.subplots(4, 1, sharex=True, figsize=(6, 9))
>>> golfcube.sections['demo'].show('depth', data='spacetime',
...                                 ax=ax[0], label='spacetime')
>>> golfcube.sections['demo'].show('depth', data='preserved',
...                                ax=ax[1], label='preserved')
>>> golfcube.sections['demo'].show('depth', data='stratigraphy',
...                                ax=ax[2], label='quick stratigraphy')
>>> golfcube.sections['demo'].show('depth', style='lines', data='stratigraphy',
...                                ax=ax[3], label='quick stratigraphy')          # noqa: E501
- show_trace(*args, ax=None, autoscale=False, **kwargs)
Plot section trace (x-y plane path).
Plot the section trace (
trace) onto an x-y planview.- Parameters:
*args – Passed to matplotlib
plot().ax (
Axesobject, optional) – A matplotlib Axes object to plot the trace. Optional; if not provided, a call is made toplt.gca()to get the current (or create a new) Axes object.autoscale (
bool) – Whether to rescale the axis based on the limits of the section. Manipulates the matplotlib autoscale attribute. Default isFalse.**kwargs – Passed to matplotlib
plot().
- property strat_attr
Stratigraphic attributes data object.
- Raises:
NoStratigraphyError – If no stratigraphy information is found for the section.
- property trace
Coordinates of the section in the dim1-dim2 plane.
Note
stack of [dim2, dim1].
- property trace_idx
Indices of section points in the dim1-dim2 plane.
- property variables
List of variables.
- property z
Up-section (vertical) coordinate.