Utility functions
The package has some more miscellaneous functions and utilities that are made publicly available.
The functions are defined in deltametrics.utils.
Utility functions
- deltametrics.utils.curve_fit(data, fit='harmonic')
Calculate curve fit given some data.
Several functional forms are available for fitting: exponential, harmonic, and linear. The input data can be 1-D, or 2-D, if it is 2-D, the data will be averaged. The expected 2-D shape is (Y-Values, # Values) where the data you wish to have fit is in the first dimension, and the second dimension is of
len(# Values).E.g. Given some mobility data output from one of the mobility metrics, fit a curve to the average of that data.
- Parameters:
data (
ndarray) – Data, either already averaged or a 2D array of of shape len(data values) x len(# values).fit (
str, optional) –A string specifying the type of function to be fit. Options are as follows:
exponential, which evaluates
(a - b) * np.exp(-c * x) + bharmonic, (default) which evaluates
a / (1 + b * x)linear, which evaluates
a * x + b
- Returns:
yfit (
ndarray) – y-values corresponding to the fitted function.popt (
array) – Optimal values for the parameters of the function. Number of parameters is dependent on the functional form used.pcov (
ndarray) – Covariance associated with the fitted function parameters.perror (
ndarray) – One standard deviation error for the parameters (from pcov).
- deltametrics.utils.coordinates_to_segments(coordinates)
Transform coordinate [x, y] array into line segments.
- Parameters:
coordinates (
ndarray) – [N, 2] array with (x, y) coordinate pairs in rows.- Returns:
[(N-1), 2, 2 array of line segments with dimensions of each segment x x-coordinates x y-coordinates.
- Return type:
segments
- deltametrics.utils.line_to_cells(*args)
Convert a line to cell coordinates along the line.
Takes as input the line to determine coordinates along. A line defined by two Cartesian coordinate endpoints p1 and p2, may be specified in one of three ways:
a single ndarray with fields
[[x0, y0], [x1, y1]]a set of two-tuples with fields
(x0, y0), (x1, y1)a set of four floats
x0, y0, x1, y1
Cell coordinates will be ordered according to the order of the arguments (i.e., as though walking along the line from p0 to p1).
- Parameters:
line (four
float, twotuple, onendarray) – The line, defined in one of the options described above.- Returns:
x (
ndarray) – x-coordinates of cells intersected with line.y (
ndarray) – y-coordinates of cells intersected with line.
Examples
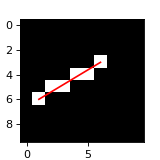
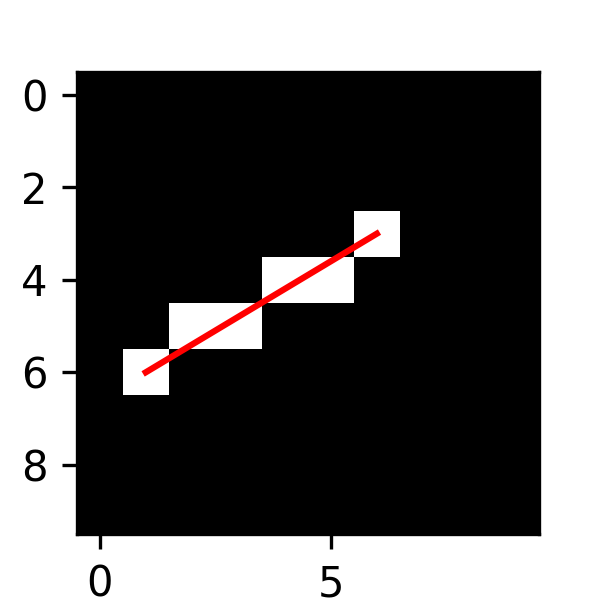
>>> from deltametrics.utils import line_to_cells
>>> p0 = (1, 6)
>>> p1 = (6, 3)
>>> x, y = line_to_cells(p0, p1)
>>> fig, ax = plt.subplots(figsize=(2, 2))
>>> _arr = np.zeros((10, 10))
>>> _arr[y, x] = 1
>>> ax.imshow(_arr, cmap='gray')
>>> ax.plot([p0[0], p1[0]], [p0[1], p1[1]], 'r-')
>>> plt.show()
- deltametrics.utils._walk_line(p0, p1)
Walk a line to determine cells along path.
Inputs depend on the steepness and direction of the input line. For a shallow line, where dx > dy, the input tuples should be in the form of (x, y) pairs. In contrast, for steep lines (where dx < dy), the input tuples should be (y, x) pairs.
Additionally, the order of the tuples should be given based on whether the line is trending upward or downward, with increasing x.
Note
TODO: finish descriptions for quadrants
Note
x in the code may not be cartesian x. Depends on quadrant of the line.
- deltametrics.utils._get_version()
Extract version number from single file, and make it availabe everywhere.
Utility Exceptions and Warnings
- exception deltametrics.utils.NoStratigraphyError(obj, var=None)
Error message for access when no stratigraphy.
- Parameters:
obj (
str) – Which object user tried to access.var (
str, optional) – Which variable user tried to access. If provided, more information is given in the error message.
Examples
Without the optional var argument:
>>> raise utils.NoStratigraphyError(golfcube)
deltametrics.utils.NoStratigraphyError: 'DataCube' object
has no preservation or stratigraphy information.
With the var argument given as
'strat_attr':>>> raise utils.NoStratigraphyError(golfcube, 'strat_attr') deltametrics.utils.NoStratigraphyError: 'DataCube' object has no attribute 'strat_attr'.
- with_traceback()
Exception.with_traceback(tb) – set self.__traceback__ to tb and return self.