deltametrics.plan.compute_channel_width
- deltametrics.plan.compute_channel_width(channelmask, section=None, return_widths=False)
Compute channel width from a mask and section.
Compute the width of channels identified in a ChannelMask along a section. This function identifies the individual channels that are crossed by the section and computes width of each channel as the along-section distance.
In essence, this processing implicitly assumes that the section cuts each channel perpendicularly. We therefore recommend using this function with a ~dm.section.CircularSection type, unless you know what you are doing. By default, only the mean and standard deviation are returned, but the list of widths can be returned with return_widths=True.
Note
If a numpy array is passed for
section, then the distance between points along the section is assumed to be ==1.- Parameters:
channelmask (
ChannelMaskorndarray) – The channel mask (i.e., should be binary) to compute channel widths from.section (
BaseSectionsubclass, orndarray) – The section along which to compute channel widths. If a Section type is passed, the .idx_trace attribute will be used to query the ChannelMask and determine widths. Otherwise, an Nx2 array can be passed, which specified the dim1-dim2 coordinate pairs to use as the trace.return_widths (bool, optional) – Whether to return (as third argument) a list of channel widths. Default is false (do not return list).
- Returns:
mean (float) – Mean of measured widths.
stddev (float) – Standard deviation of measured widths.
widths (list) – List of width measurements. Returned only if return_widths=True.
Examples
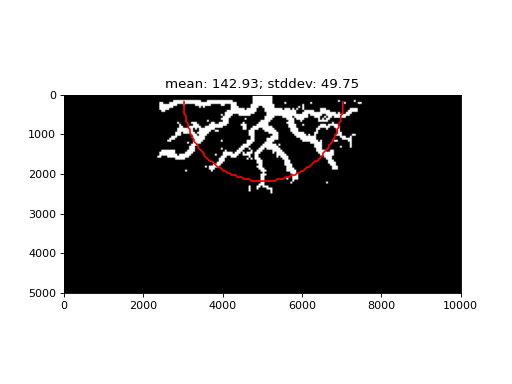
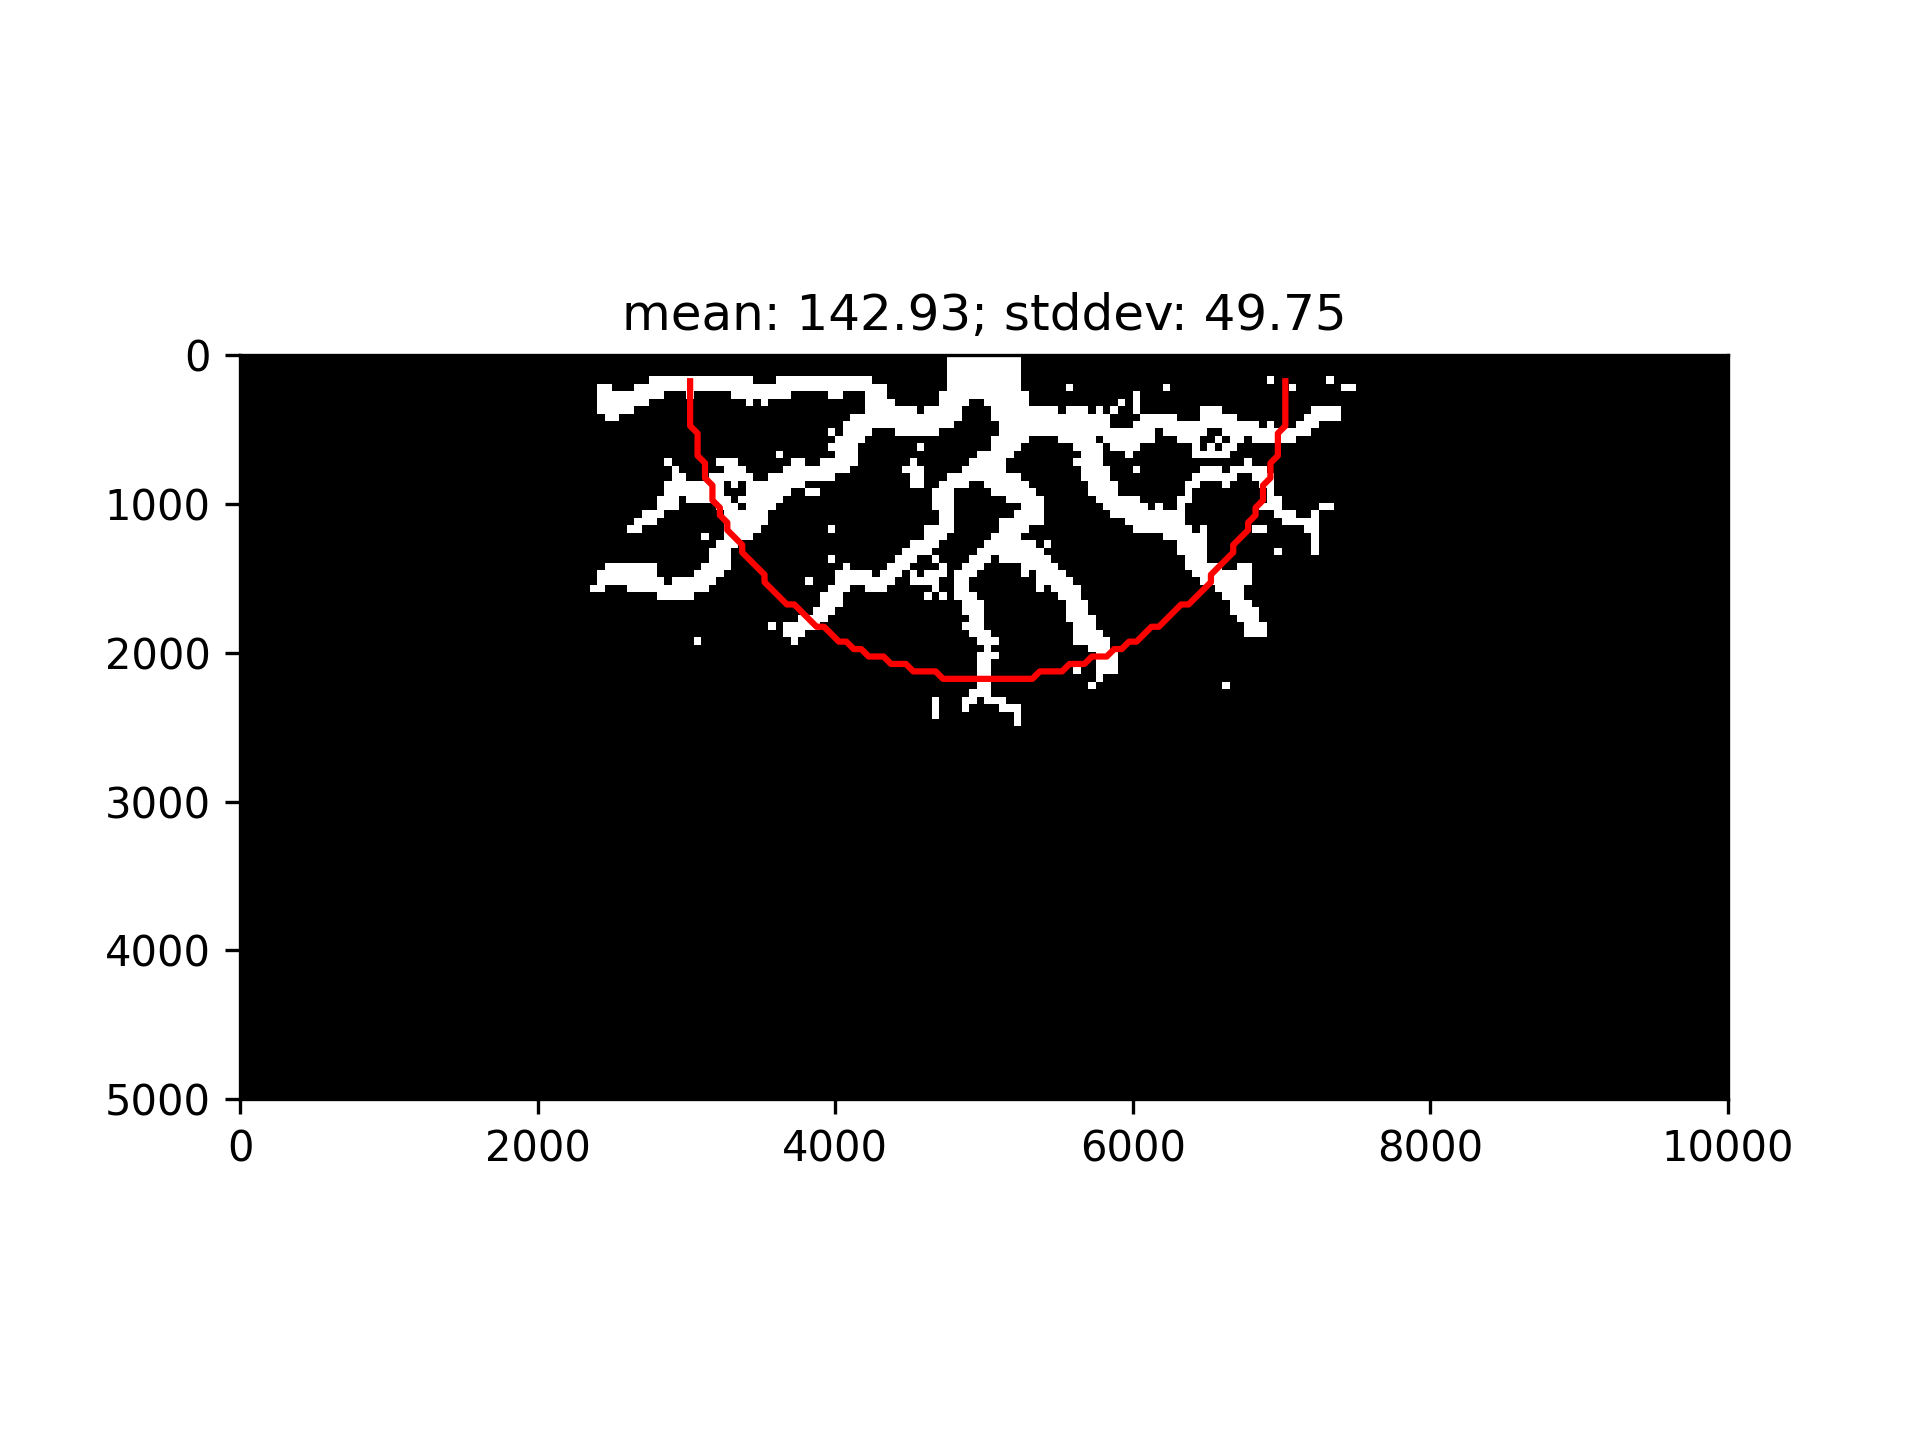
# set up the cube, mask, and section
golf = dm.sample_data.golf()
cm = dm.mask.ChannelMask(
    golf['eta'][-1, :, :],
    golf['velocity'][-1, :, :],
    elevation_threshold=0,
    flow_threshold=0.3)
sec = dm.section.CircularSection(golf, radius_idx=40)

# compute the metric
m, s, w = dm.plan.compute_channel_width(
    cm, section=sec, return_widths=True)

fig, ax = plt.subplots()
cm.show(ax=ax, ticks=True)
sec.show_trace('r-', ax=ax)
ax.set_title(f'mean: {m:.2f}; stddev: {s:.2f}')
plt.show()