deltametrics.mobility.calculate_channelized_response_variance
- deltametrics.mobility.calculate_channelized_response_variance(arr, threshold=0.2, normalize_input=False, normalize_output=False)
Calculate the Channelized Response Variance (CRV) [1].
This function takes a t-x-y array and calculates its directional CRV. In short, the function does the following:
Normalizes the array at each time slice if desired.
Calculates the CRV magnitude (aka variance along time-axis) and normalizes this array if desired.
Does linear regressions through time for each pixel and returns the slopes.
Calculates the directional CRV using a slope threshold value.
Returns the CRV magnitude, slopes, and directional CRV values
- Parameters:
arr (numpy.ndarray) – A t-x-y 3-D array to calculate the CRV on.
threshold (float, optional) – Threshold for CRV calculation. The default is 0.2.
normalize_input (bool, optional) – Whether to normalize the input images pixel values to 0-1. The default is False.
normalize_output (bool, optional) – Whether to normalize the output image pixel values to 0-1. The default is False.
- Returns:
crv_magnitude (numpy.ndarray) – A t-x-y 3-D array with the CRV magnitude.
slopes (numpy.ndarray) – A t-x-y 3-D array with the slopes of the linear regressions.
directional_crv (numpy.ndarray) – A t-x-y 3-D array with the directional CRV.
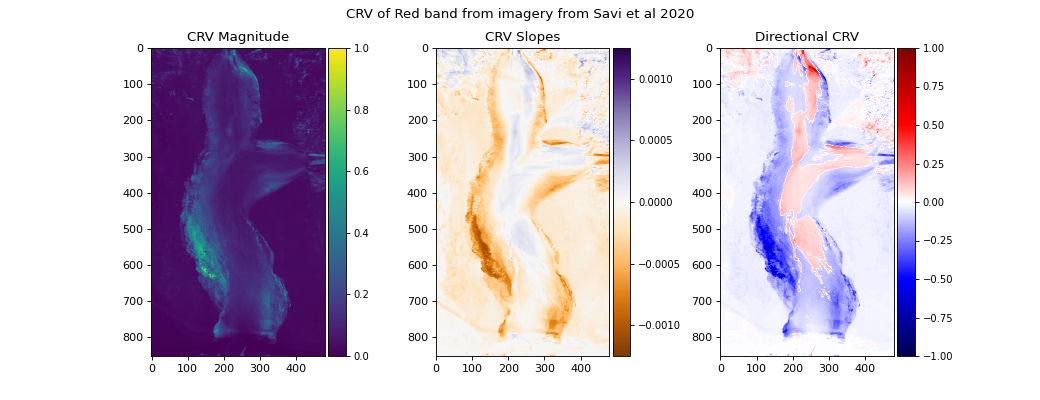
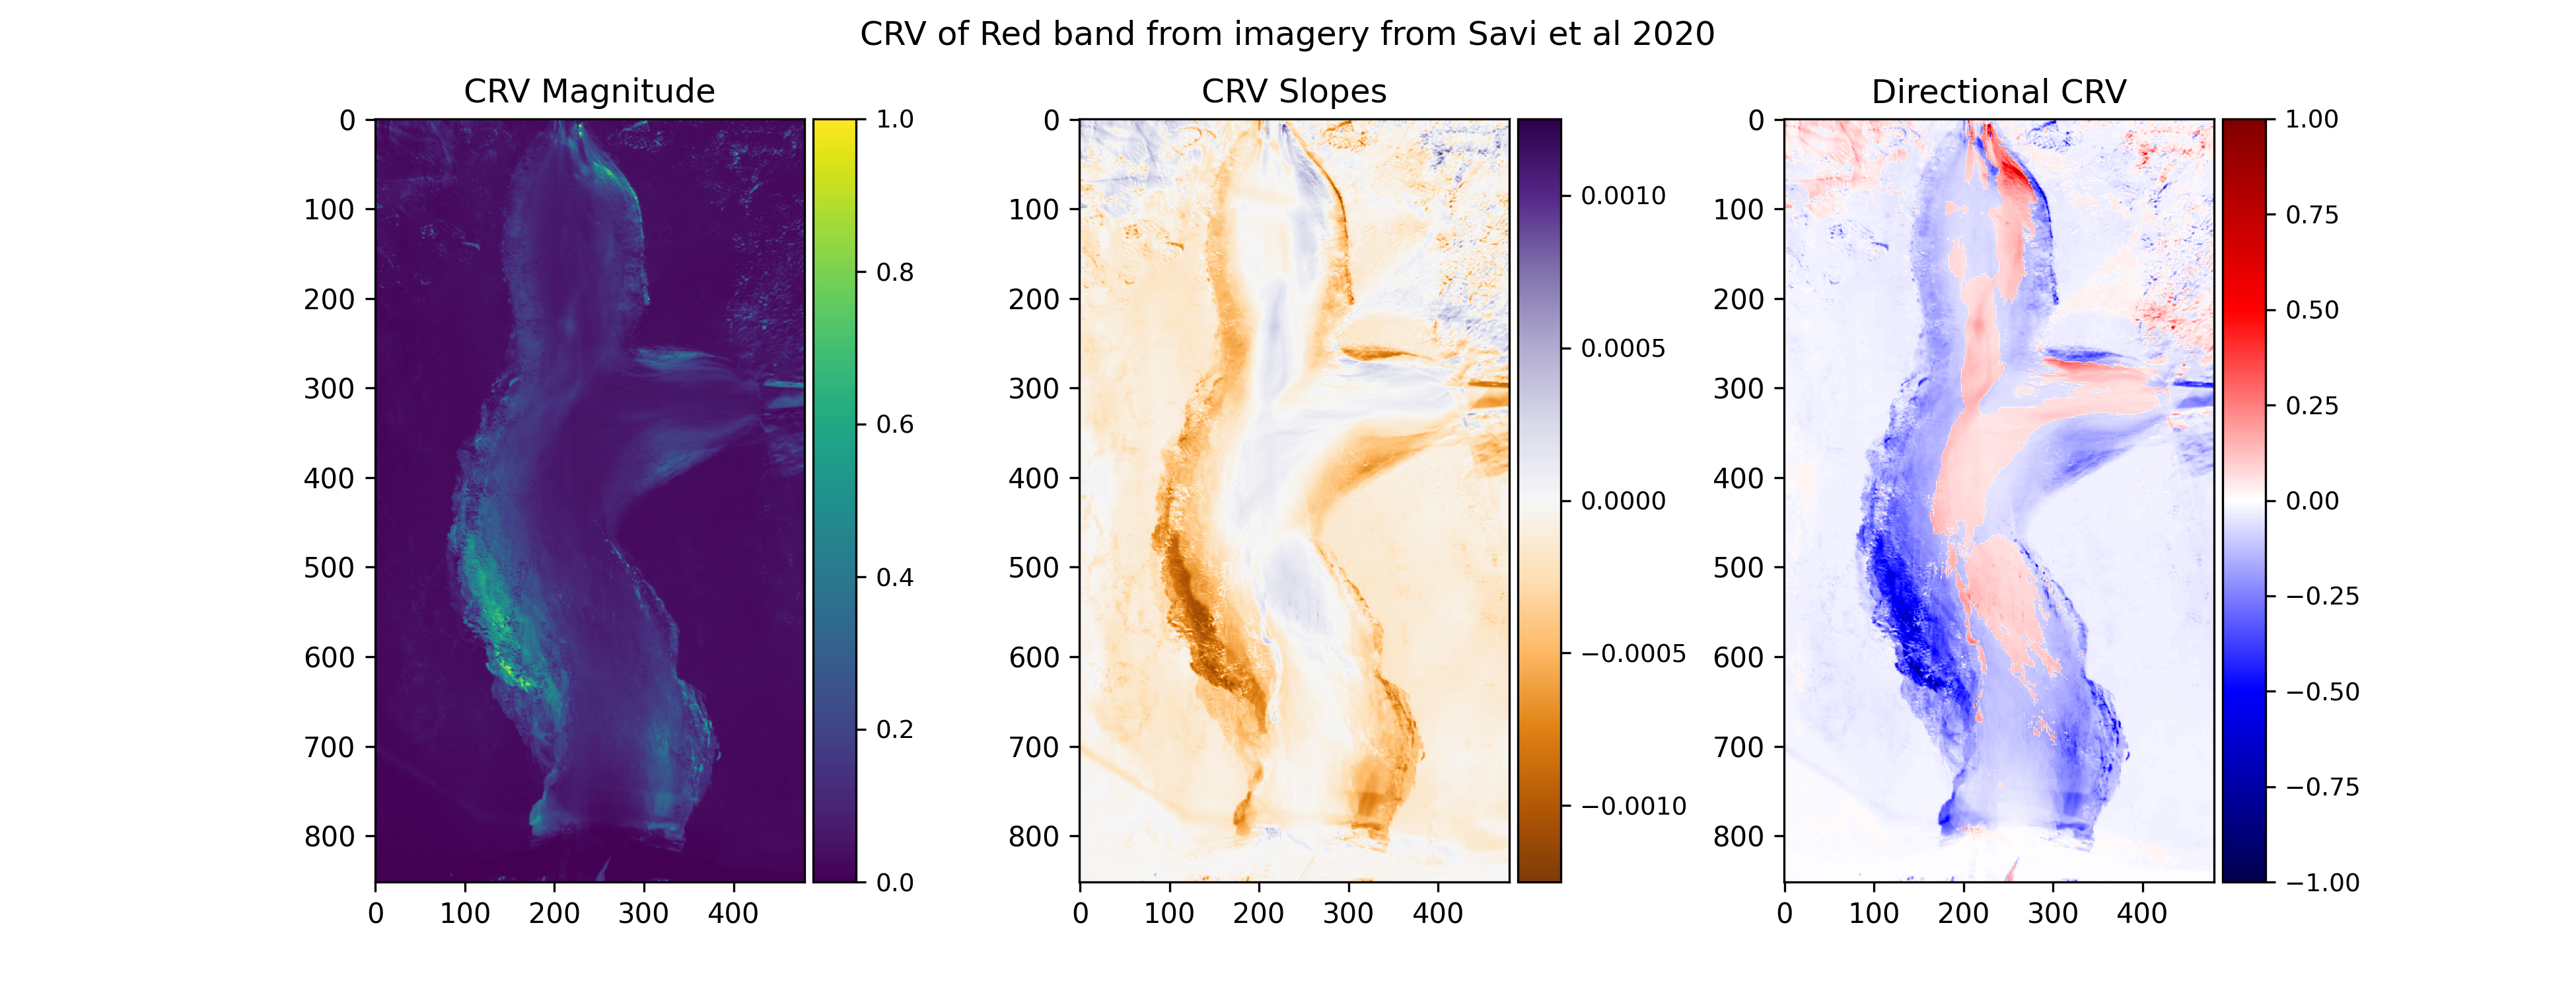
Examples
>>> # Load overhead imagery sample data from Savi et al 2020
>>> img, _ = dm.sample_data.savi2020()
>>> # Calculate the CRV on the "Red" band
>>> crv_mag, slopes, crv = dm.mobility.calculate_channelized_response_variance(
...    img['red'].data, threshold=0.0,
...    normalize_input=True, normalize_output=True)
>>> # plot the results
>>> fig, ax = plt.subplots(1, 3, figsize=(13, 5))
>>> i0 = ax[0].imshow(crv_mag, vmin=0, vmax=1)
>>> ax[0].set_title('CRV Magnitude')
>>> dm.plot.append_colorbar(i0, ax=ax[0], size=10)
>>> s_ex = np.max([np.abs(slopes.min()), slopes.max()])
>>> i1 = ax[1].imshow(slopes, vmin=-1*s_ex, vmax=s_ex, cmap='PuOr')
>>> ax[1].set_title('CRV Slopes')
>>> dm.plot.append_colorbar(i1, ax=ax[1], size=10)
>>> i2 = ax[2].imshow(crv, vmin=-1, vmax=1, cmap='seismic')
>>> ax[2].set_title('Directional CRV')
>>> dm.plot.append_colorbar(i2, ax=ax[2], size=10)
>>> fig.suptitle('CRV of Red band from imagery from Savi et al 2020')
>>> plt.show()