deltametrics.mask.EdgeMask
- class deltametrics.mask.EdgeMask(*args, **kwargs)
Identify the land-water edges.
An edge mask object, delineates the boundaries between land and water. Edge identification is implemented via Canny edge detection from skimage (
skimage.feature.canny).Examples
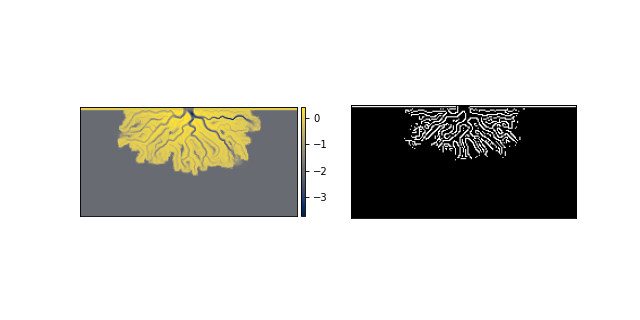
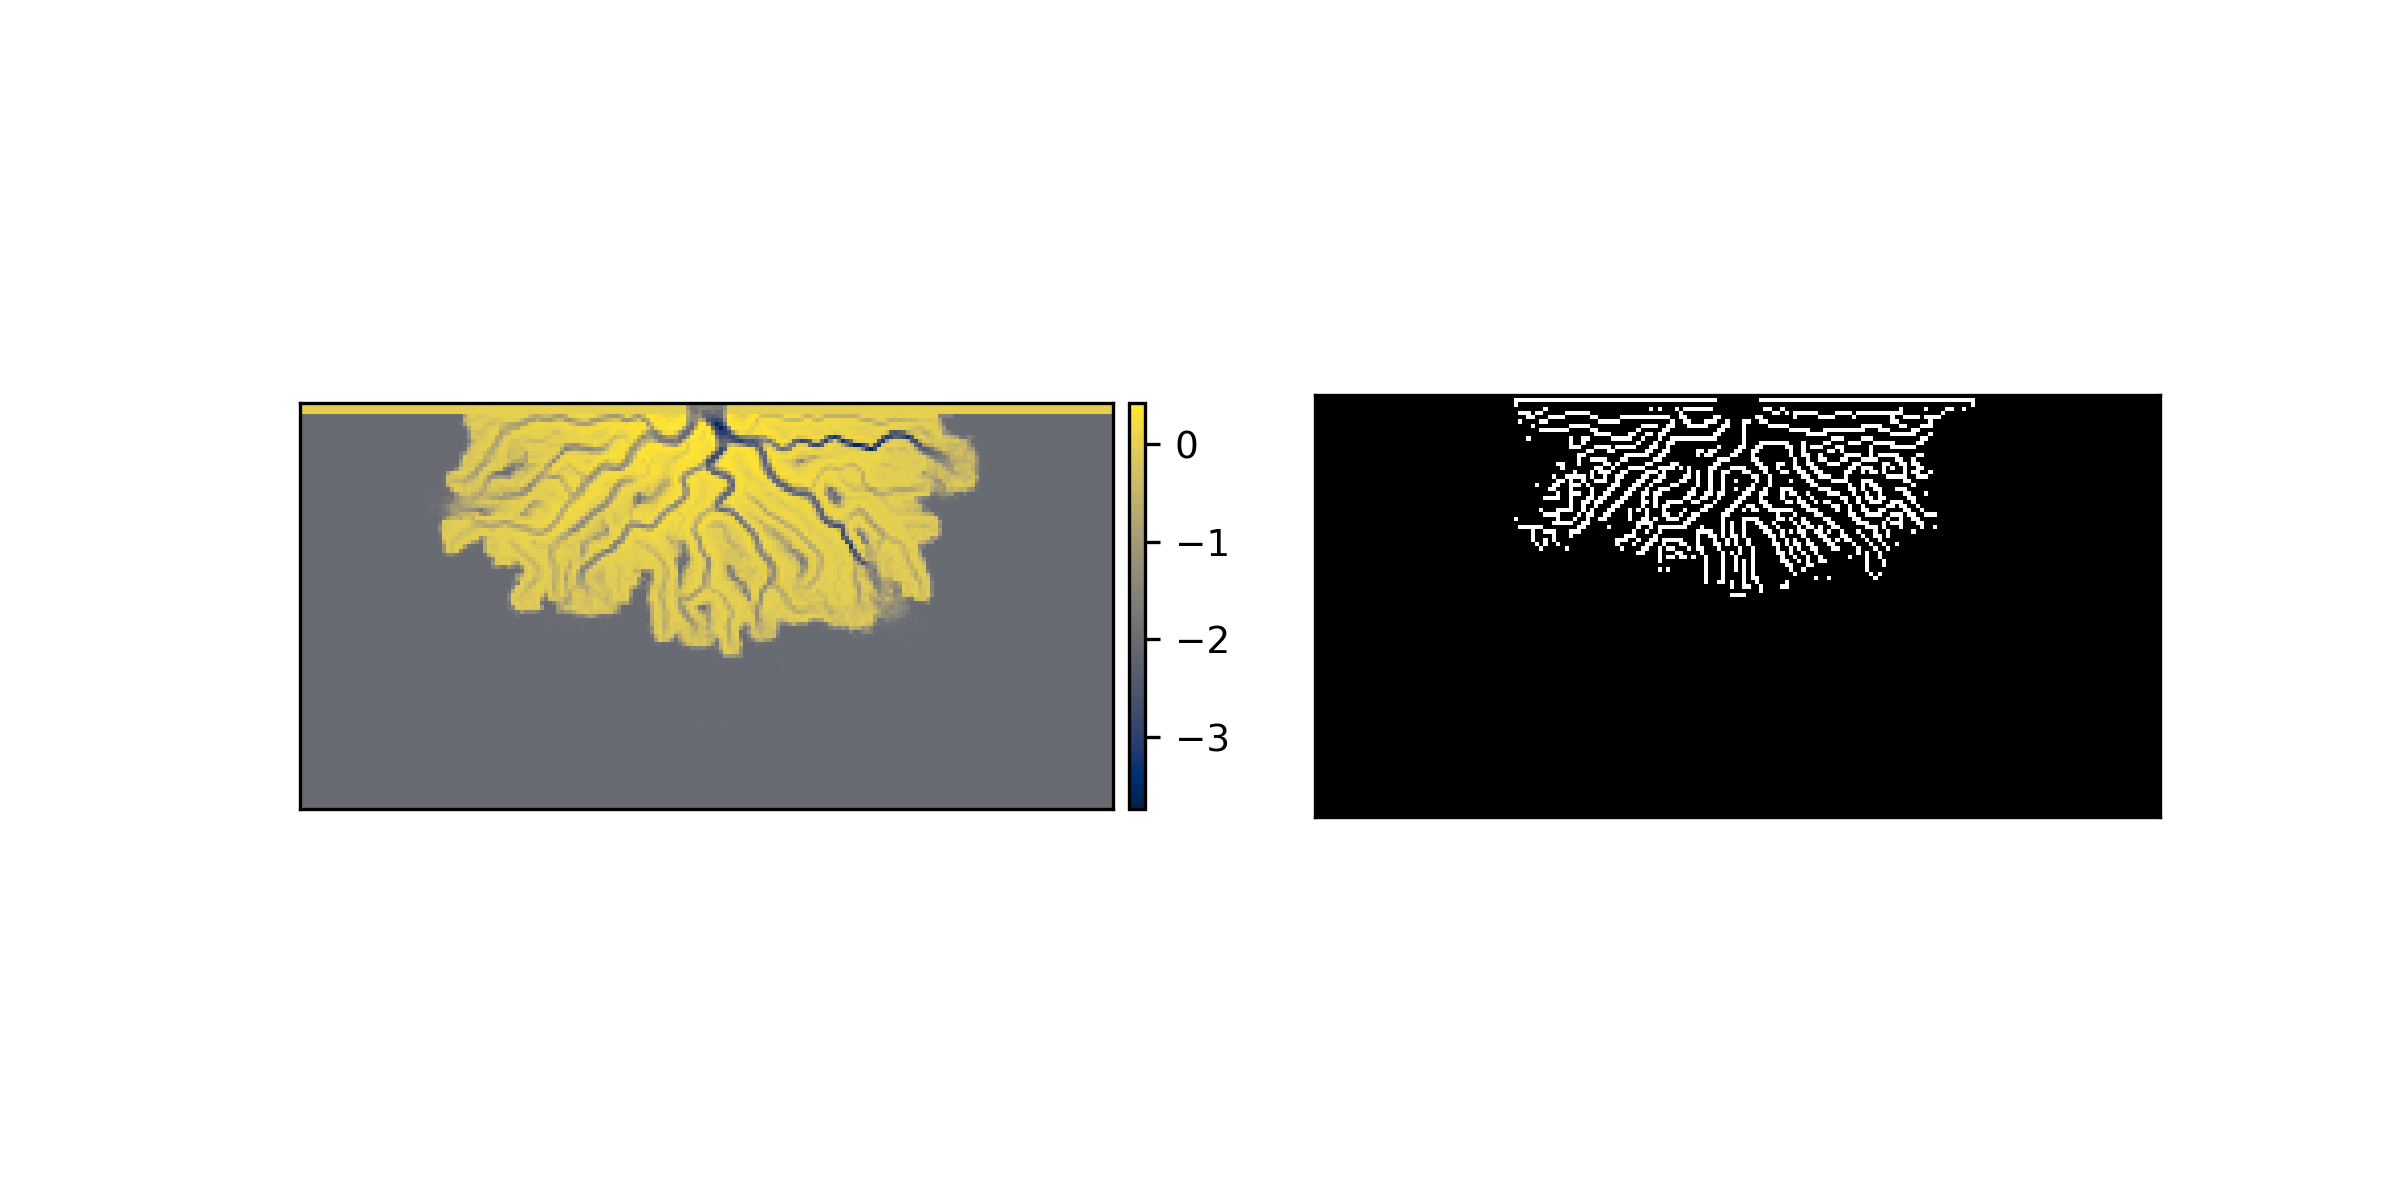
Initialize the edge mask from elevation data:
golfcube = dm.sample_data.golf()
edgmsk = dm.mask.EdgeMask(
    golfcube['eta'][-1, :, :],
    elevation_threshold=0)

fig, ax = plt.subplots(1, 2, figsize=(8, 4))
golfcube.quick_show('eta', idx=-1, ax=ax[0])
edgmsk.show(ax=ax[1])
plt.show()

- __init__(*args, **kwargs)
Initialize the EdgeMask.
Initializing the edge mask requires either a 2-D array of topographic data, or it can be computed using the
LandMaskand theWetMask.- Parameters:
arr (ndarray) – The data array to make the mask from.
contour_threshold (int, optional) –
Threshold value used for identifying the shoreline.
Default threshold opening angle used in the OAM. Default is 75 degrees. Could also be a value between 0-1 in the case of the MPM.
is_mask (bool, optional) – Whether the data in
arris already a binary mask. Default value is False. This should be set to True, if you have already binarized the data yourself, using custom routines, and want to just store the data in the EdgeMask object.landmask (
LandMask, optional) – ALandMaskobject with the land identifiedwetmask (
WetMask, optional) – AWetMaskobject with the surface water identifiedkwargs (optional) – Keyword arguments for
compute_shoremask.
Methods
__init__(*args, **kwargs)Initialize the EdgeMask.
from_Planform(_Planform, **kwargs)Create EdgeMask from a Planform.
from_Planform_and_WetMask(_Planform, ...)Create from a Planform and a WetMask.
from_array(_arr)Create an EdgeMask from an array.
from_mask(*args, **kwargs)Create a EdgeMask directly from a LandMask and a WetMask.
from_masks(*args, **kwargs)show([ax, title, ticks, colorbar])Show the mask.
trim_mask(*args[, value, axis, length])Replace a part of the mask with a new value.
Attributes
Binary mask values as integer
Binary mask values.
Type of the mask (string)
shapevariables- __getitem__(var)
Implement slicing.
Return values directly from the mask. Supported variables are only ‘mask’ or ‘integer’.
- static from_Planform(_Planform, **kwargs)
Create EdgeMask from a Planform.
- static from_Planform_and_WetMask(_Planform, _WetMask, **kwargs)
Create from a Planform and a WetMask.
Important
This instantiation pathway should only be used for custom WetMask implementations, where the
below_maskfrom theOpeningAnglePlanformis not sufficient to capture the wet area of the delta.Hint
To create an EdgeMask from an existing WetMask and LandMask, see the static method
from_mask.Examples
- static from_array(_arr)
Create an EdgeMask from an array.
Note
Instantiation with from_array will attempt to any data type (dtype) to boolean. This may have unexpected results. Convert your array to a boolean before using from_array to ensure the mask is created correctly.
- Parameters:
_arr (
ndarray) – The array with values to set as the mask. Can be any dtype but will be coerced to boolean.
- static from_mask(*args, **kwargs)
Create a EdgeMask directly from a LandMask and a WetMask.
- property integer_mask
Binary mask values as integer
Important
integer_mask is a boolean array as
0and1(integers). It is not suitible for multidimensional array indexing; see alsomask.Read-only mask attribute.
- Type:
ndarray
- property mask
Binary mask values.
Important
mask is a boolean array (not integer). See also
integer_mask.Read-only mask attribute.
- Type:
ndarray
- property mask_type
Type of the mask (string)
- show(ax=None, title=None, ticks=False, colorbar=False, **kwargs)
Show the mask.
The Mask is shown in a matplotlib axis with imshow. The mask values are accessed from
integer_mask, so the display will show as0forFalseand1forTrue. Default colormap is black and white.Hint
Passes **kwargs to
matplotlib.imshow.- Parameters:
ax (
matplotlib.pyplot.Axes) – Which axes object to plot into.
- trim_mask(*args, value=False, axis=1, length=None)
Replace a part of the mask with a new value.
This is sometimes necessary before using a mask in certain computations. Most often, this method is used to manually correct domain edge effects.
- Parameters:
*args (
BaseCubesubclass, optional) – Optionally pass a Cube object to the mask, and the dimensions to trim/replace the mask by will be inferred from the cube. In this case,axisandlengthhave no effect.value – Value to replace in the trim region with. Default is
False.axis – Which edge to apply the trim of
lengthto. Default is 1, the top domain edge.length – The length of the trim. Note that this is not the array index.
Examples