How to set up any dataset to work with DeltaMetrics
This guide describes how to set up any spatiotemporal (t-x-y) dataset to work with DeltaMetrics.
Hint
If you are trying DeltaMetrics for the first time with your data, and want a quick and simple test, check out this guide
First, let’s make some sample data:
import numpy as np
import matplotlib.pyplot as plt

from netCDF4 import Dataset
import os

import deltametrics as dm

## create the model data
# some spatial information
x = np.arange(0, 6, 0.1)
y = np.arange(0, 3, 0.1)

# some temporal information
t = np.arange(1, 5)

# meshes for each to make fake data
T, Y, X = np.meshgrid(t, y, x, indexing='ij')

# make fake time by x by y data
#   hint: this would be the data from a model, experiment, or the field
eta = np.sin(T * X + Y)
velocity = np.cos(T * Y + X)
H_SL = np.linspace(0.25, 0.9, num=len(t)) # sea level
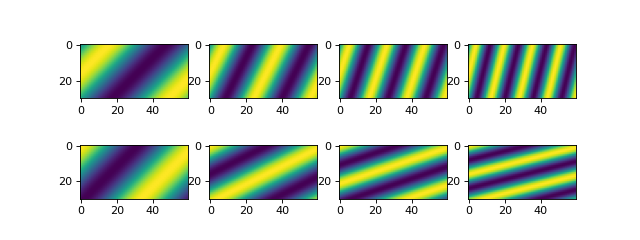
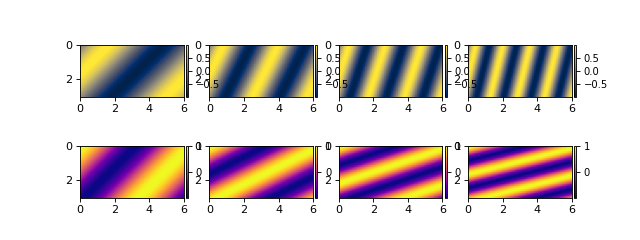
And we can see what this data looks like for a comparison with the data when we eventually have it in a DataCube.
# check out the data before we save it into a netcdf file
print("eta shape:", eta.shape)
fig, ax = plt.subplots(2, len(t), figsize=(8, 3))
for i, _t in enumerate(t):
    ax[0, i].imshow(eta[i, :, :])
    ax[1, i].imshow(velocity[i, :, :])
plt.show()

Note
You can name the spatial dimensions anything. Here, we have set the data up so that y is the first spatial dimension; this is opposite from pyDeltaRCM output data, where x is the downstream first spatial dimension.
Connecting with NetCDF
The standard I/O format for data used in DeltaMetrics is a NetCDF4 file, structured as sets of arrays. NetCDF was designed with dimensional data in mind, so that we can use common dimensions to align and manipulate multiple different underlying variables.
Important
Taking the time to set your data up correctly in a netCDF file is the preferred way to use DeltaMetrics with your own data.
This guide is not meant to be an exhaustive guide on the netCDF format, so we provide only a simple overview of some core components that affect DeltaMetrics.
dataset: the file, including all of the data and metadata to describe that data
variable: a field in the dataset that contains numeric information
dimension: a field in the dataset describing one dimension of the underlying data variables
group: a mechanism for constructing a hierarchy of information within the dataset.
DeltaMetrics NetCDF data standards
For DeltaMetrics to correctly work with underlying data, you must properly configure the dimensions and variables of the dataset.
DeltaMetrics expects your core underlying spatiotemporal data (like 2D fields of elevation data, velocity, etc) to be organized into 3D arrays, with time along the first axis and two spatial dimensions along the next two axes.
DeltaMetrics expects at least three dimensions defined in the dataset, one of which must be named
time, and the other two can have any name that describes the spatial dimensions of the data (e.g., x, lon, easting, etc.).DeltaMetrics expects a variable with name exactly matching the name of each of the three previous dimensions.
DeltaMetrics expects some number of variables with arbitrary names that each contain a 3D array of spatiotemporal data of interest. I.e., this is the actual model/field/experiment data.
DeltaMetrics expects there to be a group with name meta, which contains any information relevant to the spatiotemporal data. E.g., sea level, coordinates of sediment feed location.
Sample code for creating a DeltaMetrics NetCDF file with Python
Now, we write out the data to a netCDF file.
Hint
You can use None as the length of the time dimension, if you want to create the NetCDF file while your model runs, and you do not know the size a priori.
output_folder = './output'
file_path = os.path.join(output_folder, 'model_output.nc')
## create and fill the netcdf file
output_netcdf = Dataset(file_path, 'w',
                        format='NETCDF4')

# add some description information (see netCDF docs for more)
output_netcdf.description = 'Output from MyFakeModel'
output_netcdf.source = 'MyFakeModel v0.1'

# create time and spatial netCDF dimensions
output_netcdf.createDimension('time', T.shape[0])
output_netcdf.createDimension('y', T.shape[1])
output_netcdf.createDimension('x', T.shape[2])

# create time and spatial netCDF variables
v_time = output_netcdf.createVariable(
    'time', 'f4', ('time',))
v_time.units = 'second'
v_x = output_netcdf.createVariable(
    'x', 'f4', ('x'))
v_x.units = 'meter'
v_y = output_netcdf.createVariable(
    'y', 'f4', ('y'))
v_y.units = 'meter'

# fill the variables with the coordinate information
v_time[:] = t
v_x[:] = x
v_y[:] = y

# set up variables for output data grids
v_eta = output_netcdf.createVariable(
    'eta', 'f4', ('time', 'y', 'x'))
v_eta.units = 'meter'
v_velocity = output_netcdf.createVariable(
    'velocity', 'f4', ('time', 'y', 'x'))
v_velocity.units = 'meter/second'
v_eta[:] = eta
v_velocity[:] = velocity

# set up metadata group and populate variables
output_netcdf.createGroup('meta')
v_L0 = output_netcdf.createVariable(  # a scalar, the inlet length
    'meta/L0', 'f4', ())  # no dims for scalar
v_L0.units = 'cell'
v_L0[:] = 5
v_H_SL = output_netcdf.createVariable( # an array, the sea level
    'meta/H_SL', 'f4', ('time',))  # only has time dimensions
v_H_SL.units = 'meters'
v_H_SL[:] = H_SL

# close the netcdf file
output_netcdf.close()
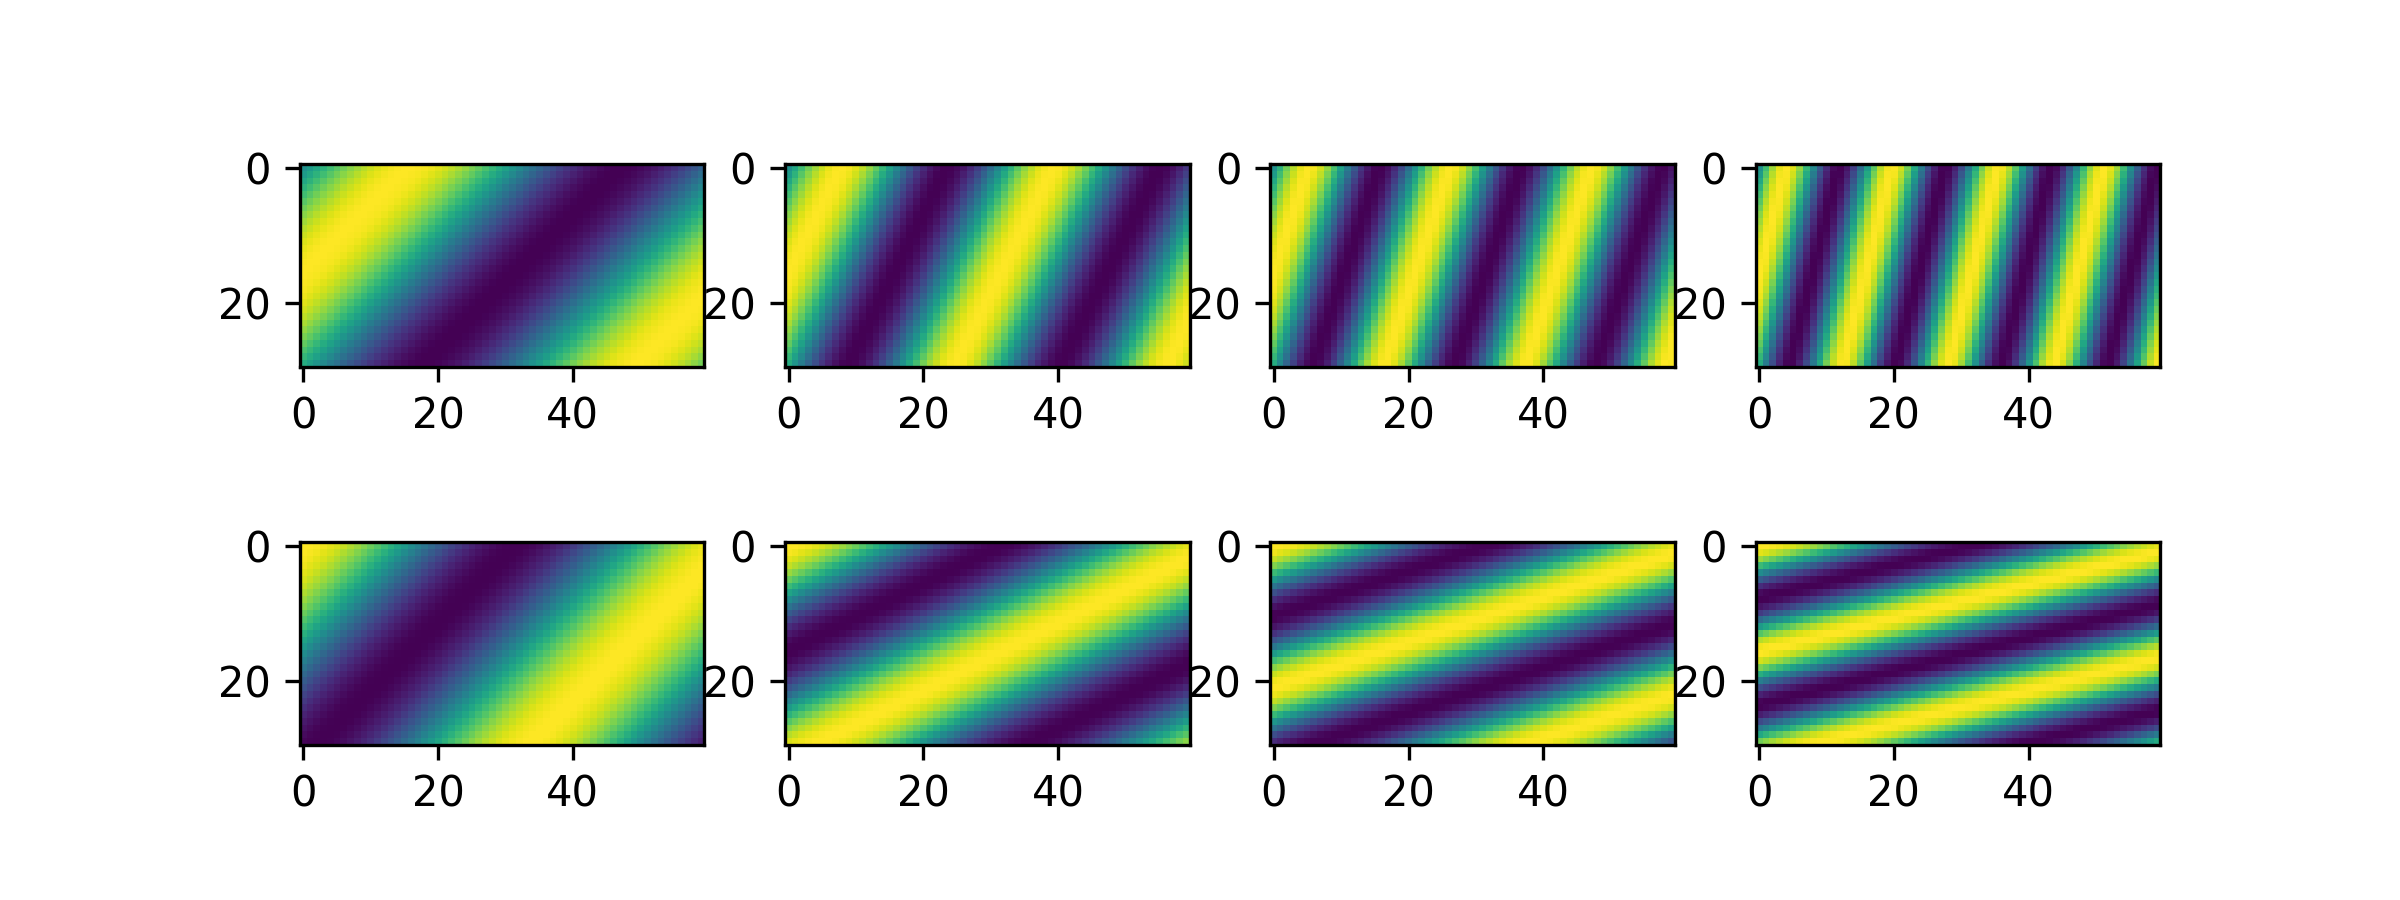
Now, let’s load the NetCDF file with DeltaMetrics. Make a cube by pointing to the directory and file location.
nc_datacube = dm.cube.DataCube(os.path.join(output_folder, 'model_output.nc'))

fig, ax = plt.subplots(2, len(t), figsize=(8, 3))
for i, _ in enumerate(t):
    nc_datacube.quick_show(
        'eta', idx=i,
        ticks=True, ax=ax[0, i])
    nc_datacube.quick_show(
        'velocity', idx=i,
        ticks=True, ax=ax[1, i])
plt.show()

Note that the coordinates of the data (i.e., the x range in 0 to 6) have been correctly loaded from the NetCDF file and applied in the DataCube.
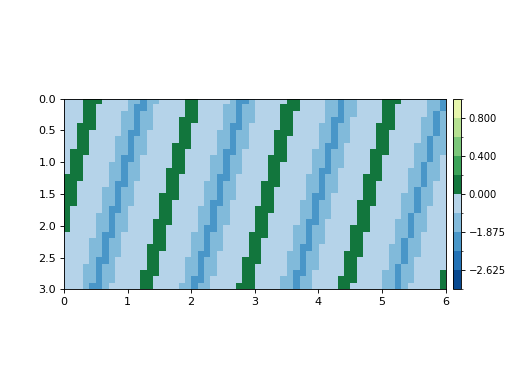
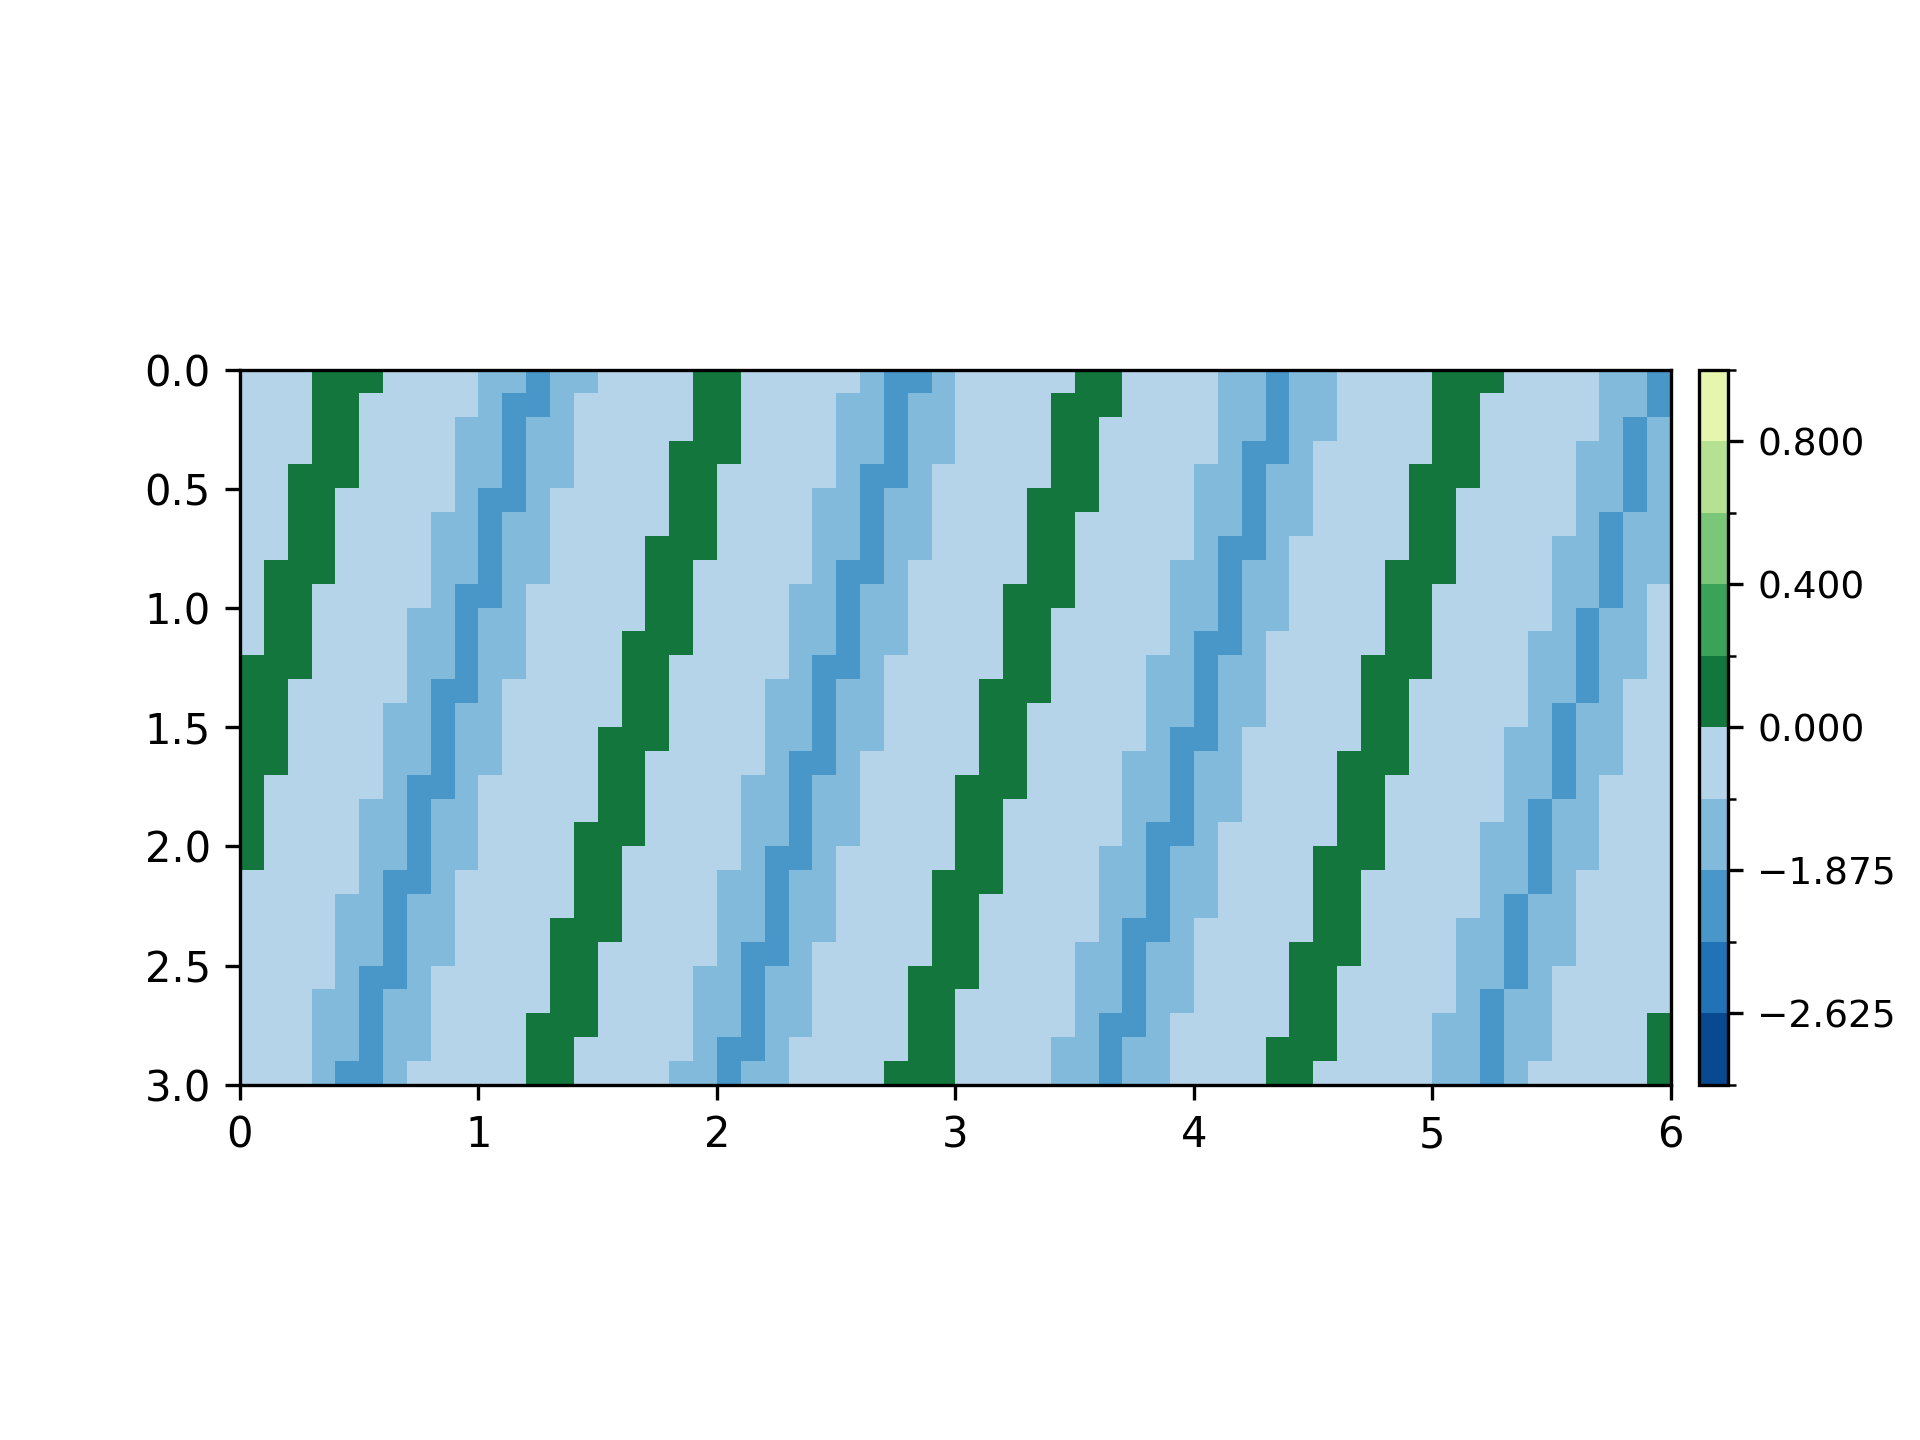
To show that the components of sea level and elevation have been connected:
dm.plot.aerial_view(
    nc_datacube['eta'][-1, :, :],
    datum=nc_datacube.meta['H_SL'][-1],
    ticks=True)

Sample code for working with data loaded in memory
If you are not at all concerned with the size of your data, and loading all of this information into memory in addition to whatever computational requirements you have for your analysis, you can input data directly to the DataCube as a dictionary.
Note
this example uses the sample data defined above.
# create the dictionary
data_dict = {'eta': eta,
             'velocity': velocity}

# make a cube from it
dict_datacube = dm.cube.DataCube(
    data_dict,
    dimensions={'time': t,
                'y': y,
                'x': x})

fig, ax = plt.subplots(2, len(t), figsize=(8, 3))
for i, _ in enumerate(t):
    dict_datacube.quick_show(
        'eta', idx=i,
        ticks=True, ax=ax[0, i])
    dict_datacube.quick_show(
        'velocity', idx=i,
        ticks=True, ax=ax[1, i])
plt.show()
Notice that dimensions (range of x from 0 to 6) are properly handled, and variables are styled according to the DeltaMetrics default.
Warning
The meta data model is not integrated into the dictionary input method.
You cannot use integrated metadata to a DataCube created from a dictionary; you will need to manage and integrate this metadata manually as needed. We do not anticipate this will affect many users, but if you need the ability to add metadata to the DataCube from dictionary input, please open an issue request or submit a pull request.
If you want a basic workaround, you can create a dictionary inside the input dictionary, named meta. For example:
dict_datacube = dm.cube.DataCube(
    data_dict,
    dimensions={'time': t,
                'y': y,
                'x': x,
                'meta': {'H_SL': H_SL}})
But be aware that dimensions will not be attached to the metadata (unless you pass in a DataArray), and you cannot use the .meta accessor, and instead would need to use dict_datacube['meta']['H_SL'].
Conventions for data and information
While not strictly necessary, it may be helpful to adhere to a naming convention that DeltaMetrics uses internally to define some common attributes of sedimentary systems.
Spatiotemporal variable conventions
eta: name any bed elevation variable eta. You can still use DeltaMetrics with a field with any other name to represent bed elevation (e.g., z), but the default expected name is eta, and using z may result in confusion—especially if working with stratigraphy.
Organize model data so that an inlet of sediment and water (if present) is located along the the dim1==0 domain edge. This is not strictly necessary, but some DeltaMetrics default values will work best this way.
Metadata variable naming conventions
If any of the following information is available or relevant for your model, experiment, or field site, we recommend adding this information to the meta group in an input NetCDF file.
H_SL: name any basin-wide water level as H_SL in the metadata, and define it in the same coordinate system as eta (e.g., use meters and the same elevation datum).
L0: the dim1 inlet length, number of indices from the starting edge of dim1. Do not include this field if inlet not located along dim1==0 edge.
CTR: the dim2 inlet center, number of indices from the starting edge of dim2. Do not include this field if inlet not located along dim1==0 edge.
Hint
None of these variables need to be defined; you can always manually pass them to DeltaMetrics constructors, but following the convention when creating your data file will save you many keystrokes later.