deltametrics.strat.compute_net_to_gross
- deltametrics.strat.compute_net_to_gross(sediment_volume, net_threshold=None, background=None)
Compute net-to-gross for stratigraphy.
Computes a spatially-resolved net-to-gross for a deposit. This computation is based on thresholding some data to indicate what volume is “net” (usually grain size or sand fraction data). The first axis of the data is assumed to be the vertical elevation dimension.
- Parameters:
sediment_volume (
xarrayor ndarray) – The deposit voxel array. First dimension is vertical spatial dimension.net_threshold (float, optional) – Threshold to use for splitting out the “net”. Voxels with value greater than or equal to net_threshold will be included in the net. If no value is supplied, the unweighted midpoint of the
sediment_volumedistribution (i.e.,(max + min)/2) will be used as the threshold.background (xarray, ndarray, or float, optional) – Value indicating the background or basin voxels that should be excluded from computation. If an array matching the size of
sediment_volumeis supplied, this array is assumed to be a binary array indicating the voxels to be excluded (i.e., the deposit is the inverse of background). If a float is passed, this is treated as a “no-data” value, and used to determine the background voxels. If no value is supplied, no voxels are excluded.
- Returns:
net_to_gross – A spatially-resolved net-to-gross “map”.
- Return type:
ndarrayorDataArray
Examples
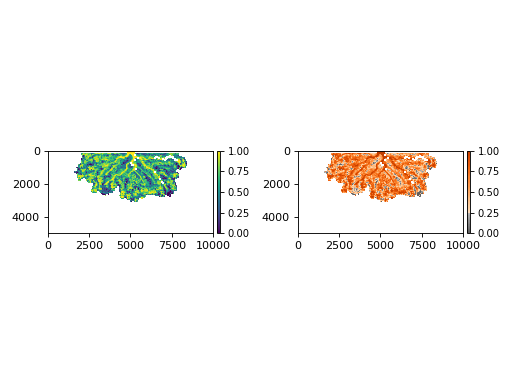
golfcube = dm.sample_data.golf()
golfstrat = dm.cube.StratigraphyCube.from_DataCube(golfcube, dz=0.1)
background = (golfstrat.Z < np.min(golfcube['eta'].data, axis=0))

net_to_gross = dm.strat.compute_net_to_gross(
    golfstrat['sandfrac'],
    net_threshold=0.5,
    background=background)

fig, ax = plt.subplots(1, 2)
im0 = ax[0].imshow(
    net_to_gross,
    extent=golfstrat.extent)
dm.plot.append_colorbar(im0, ax=ax[0])
im1 = ax[1].imshow(
    net_to_gross,
    cmap=golfstrat.varset['net_to_gross'].cmap,
    norm=golfstrat.varset['net_to_gross'].norm,
    extent=golfstrat.extent)
dm.plot.append_colorbar(im1, ax=ax[1])
plt.tight_layout()
plt.show()