deltametrics.plot.show_one_dimensional_trajectory_to_strata
- deltametrics.plot.show_one_dimensional_trajectory_to_strata(e, sigma_dist=None, dz=None, z=None, nz=None, ax=None, show_strata=True, label_strata=False)
1d elevation to stratigraphy.
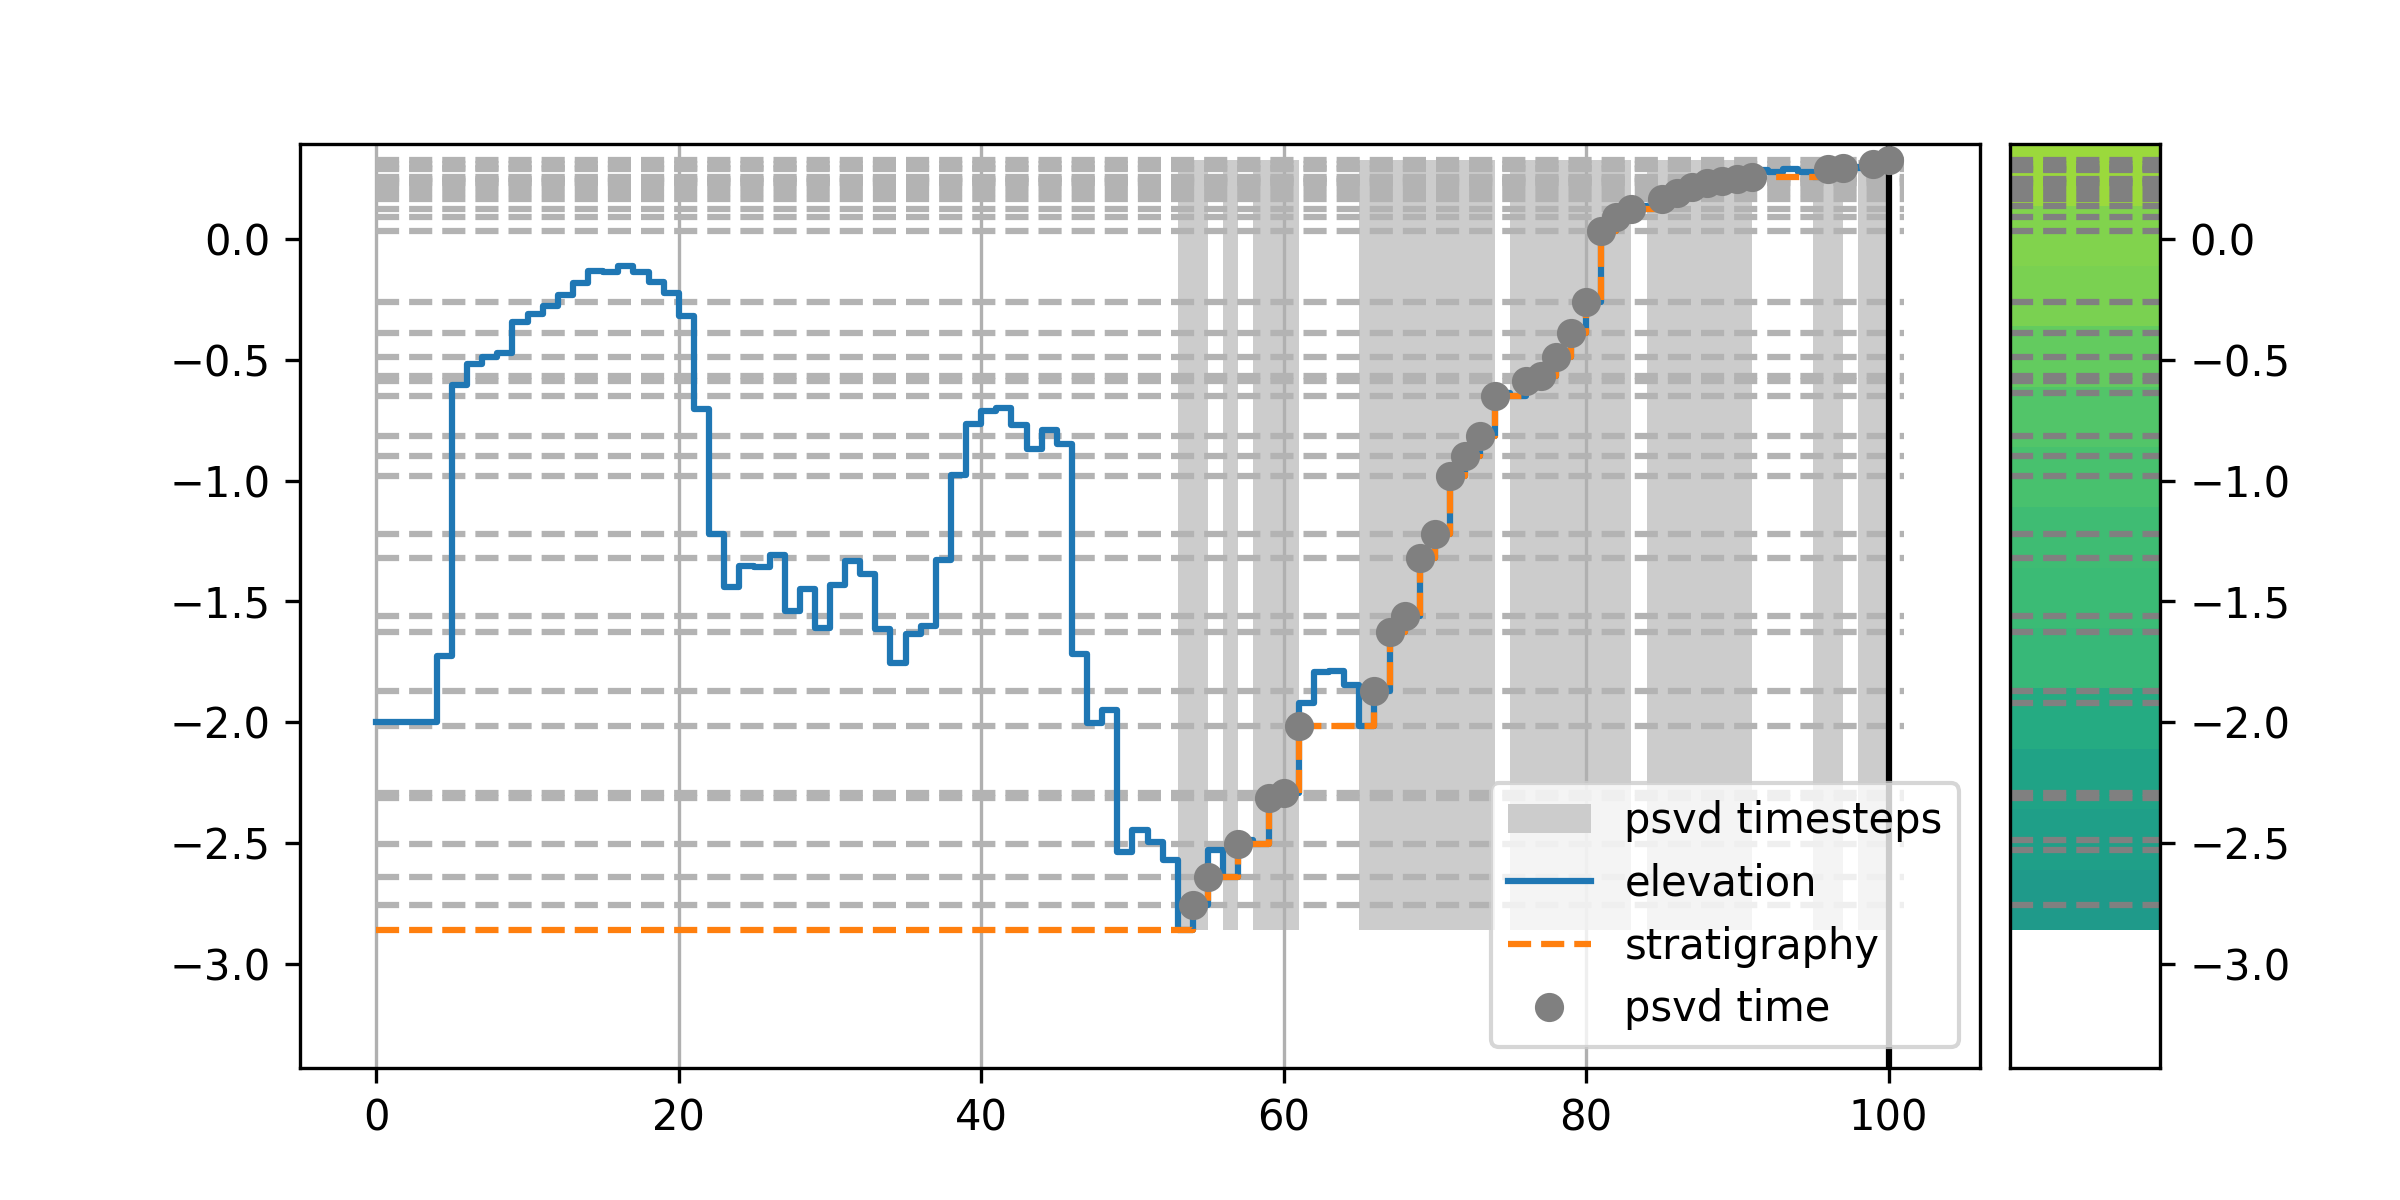
This function creates and displays a one-dimensional elevation timeseries as a trajectory of elevations, resultant stratigraphy, and time preserved in “boxy” stratigraphy. The function is helpful for description of algorithms to compute stratigraphy, and for debugging and checking outputs from computations.
For example, we can quickly visualize the processing of a 1D timeseries of bed elevations into boxy stratigraphy with this routine.
golfcube = dm.sample_data.golf()

ets = golfcube['eta'].data[:, 10, 85]  # a "real" slice of the model

fig, ax = plt.subplots(figsize=(8, 4))
dm.plot.show_one_dimensional_trajectory_to_strata(ets, ax=ax, dz=0.25)

The orange line depicts the resultant stratigraphy, with all bed-elevations above this line cut from the stratigraphy by the stratigraphic filter. The column on the right records which time-interval is recorded in the stratigraphy at each elevation.
- Parameters:
e (
ndarray) – Elevation data as a 1D array.sigma_dist (
ndarray,float,int, optional) – Optional subsidence distance argument used to adjust the elevation data to account for subsidence when computing stratigraphy. See_adjust_elevation_by_subsidencefor a complete description.z (
ndarray, optional) – Vertical coordinates for stratigraphy, in meters. Optional, and mutually exclusive withdzandnz, see_determine_strat_coordinatesfor complete description.dz (
float, optional) – Vertical resolution of stratigraphy, in meters. Optional, and mutually exclusive withzandnz, see_determine_strat_coordinatesfor complete description.nz (
int, optional) – Number of intervals for vertical coordinates of stratigraphy. Optional, and mutually exclusive withzanddz, see_determine_strat_coordinatesfor complete description.ax (
matplotlib.pyplot.axes, optional) – Axes to plot into. A figure and axes is created, if not given.show_strata (
bool, optional) – Whether to plot the resultant stratigraphy as a strip log on a second axis on the right side. This axis included numbers indicating the timestep for each voxel of preserved stratigraphy.