deltametrics.plan.Planform
- class deltametrics.plan.Planform(*args, z=None, t=None, idx=None, **kwargs)
Basic Planform object.
This class is used to slice the Cube along the dim0 axis. The object is akin to the various Section classes, but there is only the one way to slice as a Planform.
- __init__(*args, z=None, t=None, idx=None, **kwargs)
Identify coordinate defining the planform.
- Parameters:
CubeInstance (
BaseCubesubclass, optional) – Connect to this cube. No connection is made if cube is not provided.z (
float, optional)t (
float, optional)idx (
int, optional)
Notes
If no positional arguments are passed, an empty Planform not connected to any cube is returned. This cube may need to be manually connected to have any functionality (via the
connect()method); this need will depend on the type of Planform.
Methods
__init__(*args[, z, t, idx])Identify coordinate defining the planform.
connect(CubeInstance[, name])Connect this Planform instance to a Cube instance.
show(var[, ax, title, ticks, colorbar, ...])Show the planform.
Attributes
Index into underlying Cube along axis 0.
Planform name.
Planform shape.
List of variables.
- __getitem__(var)
Get a slice of the planform.
Slicing the planform instance creates an xarray DataArray instance from data for variable
var.Note
We only support slicing by string.
- Parameters:
var (
str) – Which variable to slice.- Returns:
data – The undelrying data returned as an xarray DataArray, maintaining coordinates.
- Return type:
DataArray
- connect(CubeInstance, name=None)
Connect this Planform instance to a Cube instance.
- property idx
Index into underlying Cube along axis 0.
- property name
Planform name.
Helpful to differentiate multiple Planform objects.
- property shape
Planform shape.
- show(var, ax=None, title=None, ticks=False, colorbar=True, colorbar_label=False)
Show the planform.
Method enumerates convenient routines for visualizing planform data and slices of stratigraphy.
- Parameters:
var (
str) – Which attribute to show. Can be a string for a named Cube attribute.label (
bool, str, optional) – Display a label of the variable name on the plot. Default is False, display nothing. Iflabel=True, the label name from theVariableSetis used. Other arguments are attempted to coerce to str, and the literal is diplayed.colorbar (
bool, optional) – Whether a colorbar is appended to the axis.colorbar_label (
bool, str, optional) – Display a label of the variable name along the colorbar. Default is False, display nothing. Iflabel=True, the label name from theVariableSetis used. Other arguments are attempted to coerce to str, and the literal is diplayed.ax (
Axesobject, optional) – A matplotlib Axes object to plot the section. Optional; if not provided, a call is made toplt.gca()to get the current (or create a new) Axes object.
Examples
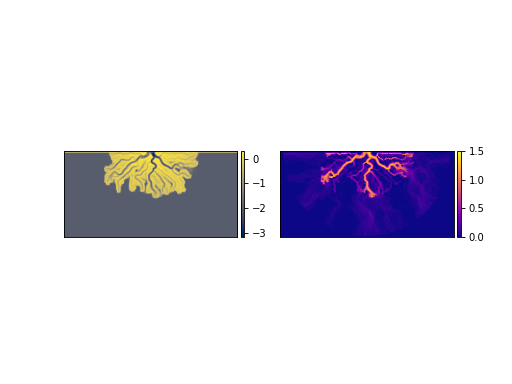
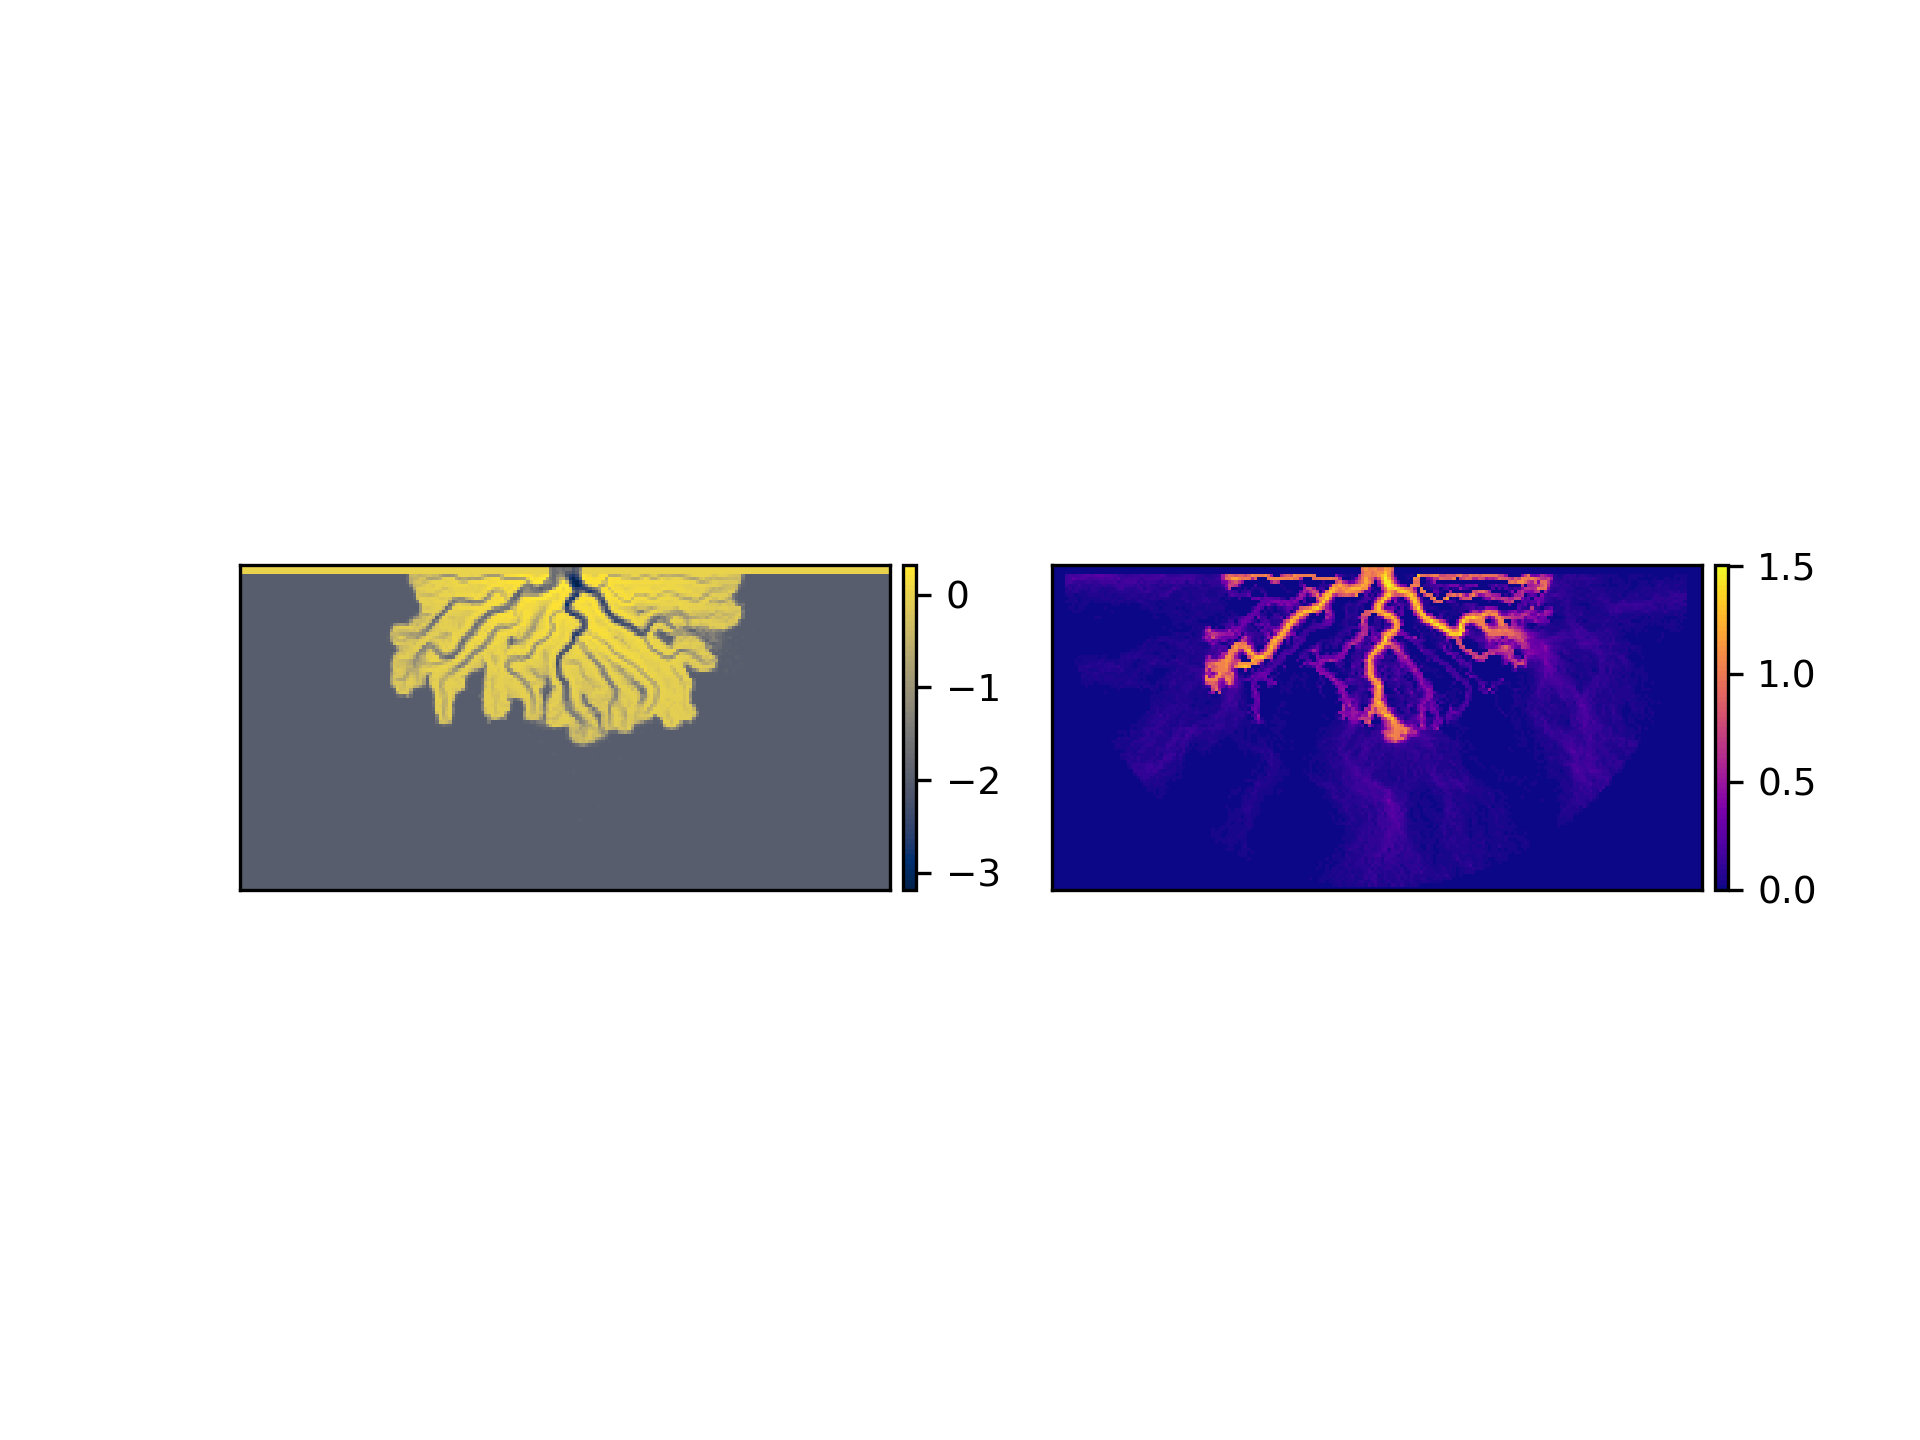
Display the eta and velocity planform of a DataCube.
>>> golfcube = dm.sample_data.golf()
>>> planform = dm.plan.Planform(golfcube, idx=70)
...
>>> fig, ax = plt.subplots(1, 2)
>>> planform.show('eta', ax=ax[0])
>>> planform.show('velocity', ax=ax[1])
>>> plt.show()

- property variables
List of variables.